
Tom Cao
You'll learn to create smart alert routing that distinguishes between critical after-hours emergencies requiring immediate PagerDuty escalation and routine issues that can wait for business hours.
1. Incident Response Process
Effective incident management follows a structured approach that automation can enhance at every stage:
Preparation
- Documentation: Maintain runbooks and response procedures
- Monitoring setup: Configure Prometheus alerts with appropriate thresholds
- Team readiness: Ensure on-call schedules and escalation paths are clear
Detection & Analysis
- Alert triggering: Prometheus detects anomalies based on predefined rules
- Initial assessment: Automated classification of severity and impact
- Contextual enrichment: Adding relevant system information to alerts
Recovery
- Notification routing: Directing alerts to appropriate channels (PagerDuty, Slack)
- Guided response: Linking to relevant runbooks or documentation
- Automated remediation: Triggering recovery scripts for known issues
Post-incident Activity
- Documentation: Capturing timeline and response details
- Analysis: Identifying root causes and prevention opportunities
- Process improvement: Updating monitoring rules and response workflows
In the below steps, we will make a automation flow that we cover the Detection & Analysis and routing the alert based on the contexts.
2. Building an n8n Incident Response Workflow
Let's create a practical workflow that handles Prometheus alert management intelligently, ensuring critical issues will be sent while considering the severity, business hours,…
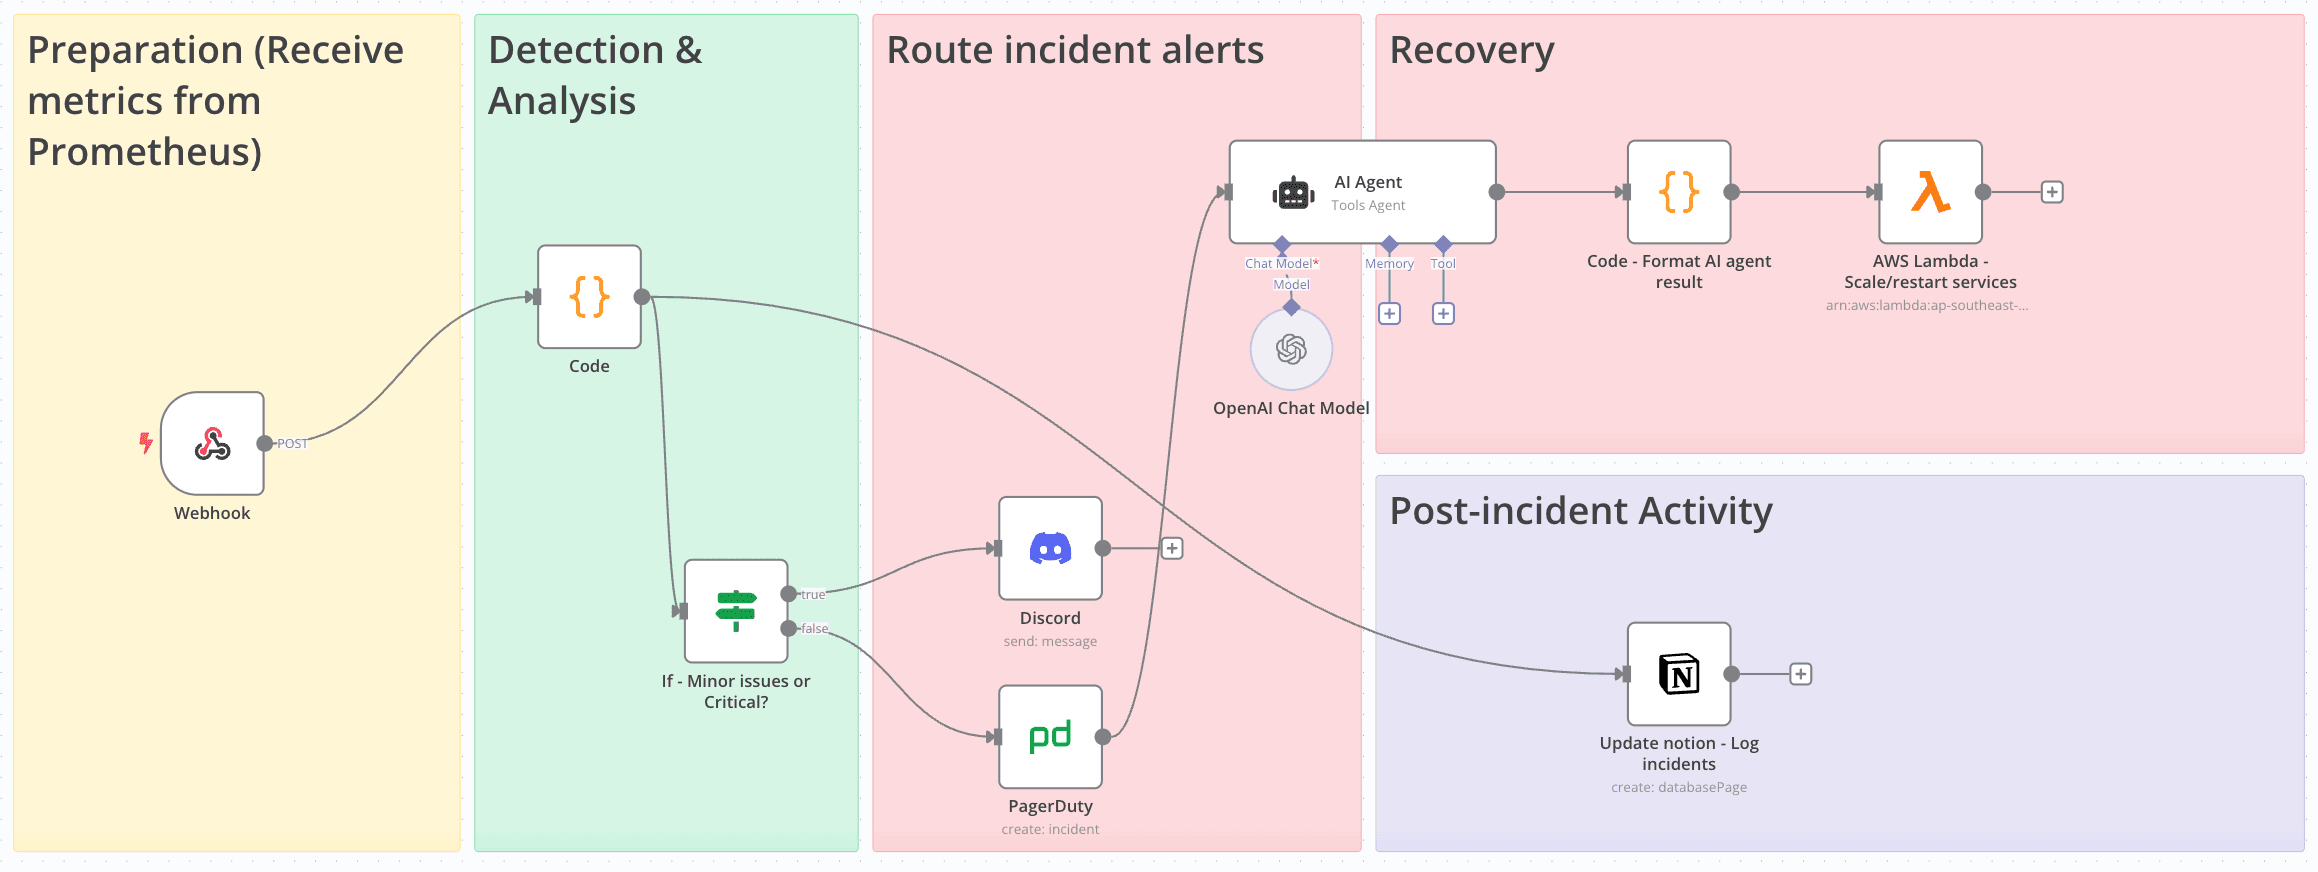
Workflow Overview
Our goal is to build a system that:
- Receives alerts from Prometheus/AlertManager
- Analyzes severity and business hours
- Routes critical after-hours alerts to PagerDuty for immediate response
- Sends less urgent or business-hours alerts to Slack/Discord
- Automate incident resolution based on AI-agent suggestion
- Lambda function to execute your operations (you can custom for ECS, EKS,...)
- Documents all incidents in a structured format (Notion)
This approach ensures your team isn't woken up unnecessarily while maintaining rapid response for genuine emergencies.
Setting Up the Monitoring Stack
Before building our n8n workflow, we need a properly configured monitoring system:
Install the Prometheus stack
- Prometheus server for metrics collection
- Exporters for your specific services
- AlertManager for alert handling
- Grafana for visualization
To easily configure the stack, I’ve made a click-run scripts to deploy “Node Exporter - Prometheus - Alert Manager - Grafana Stack” here. You can take a look, pull and deploy yourself
Configure alert rules in Prometheus
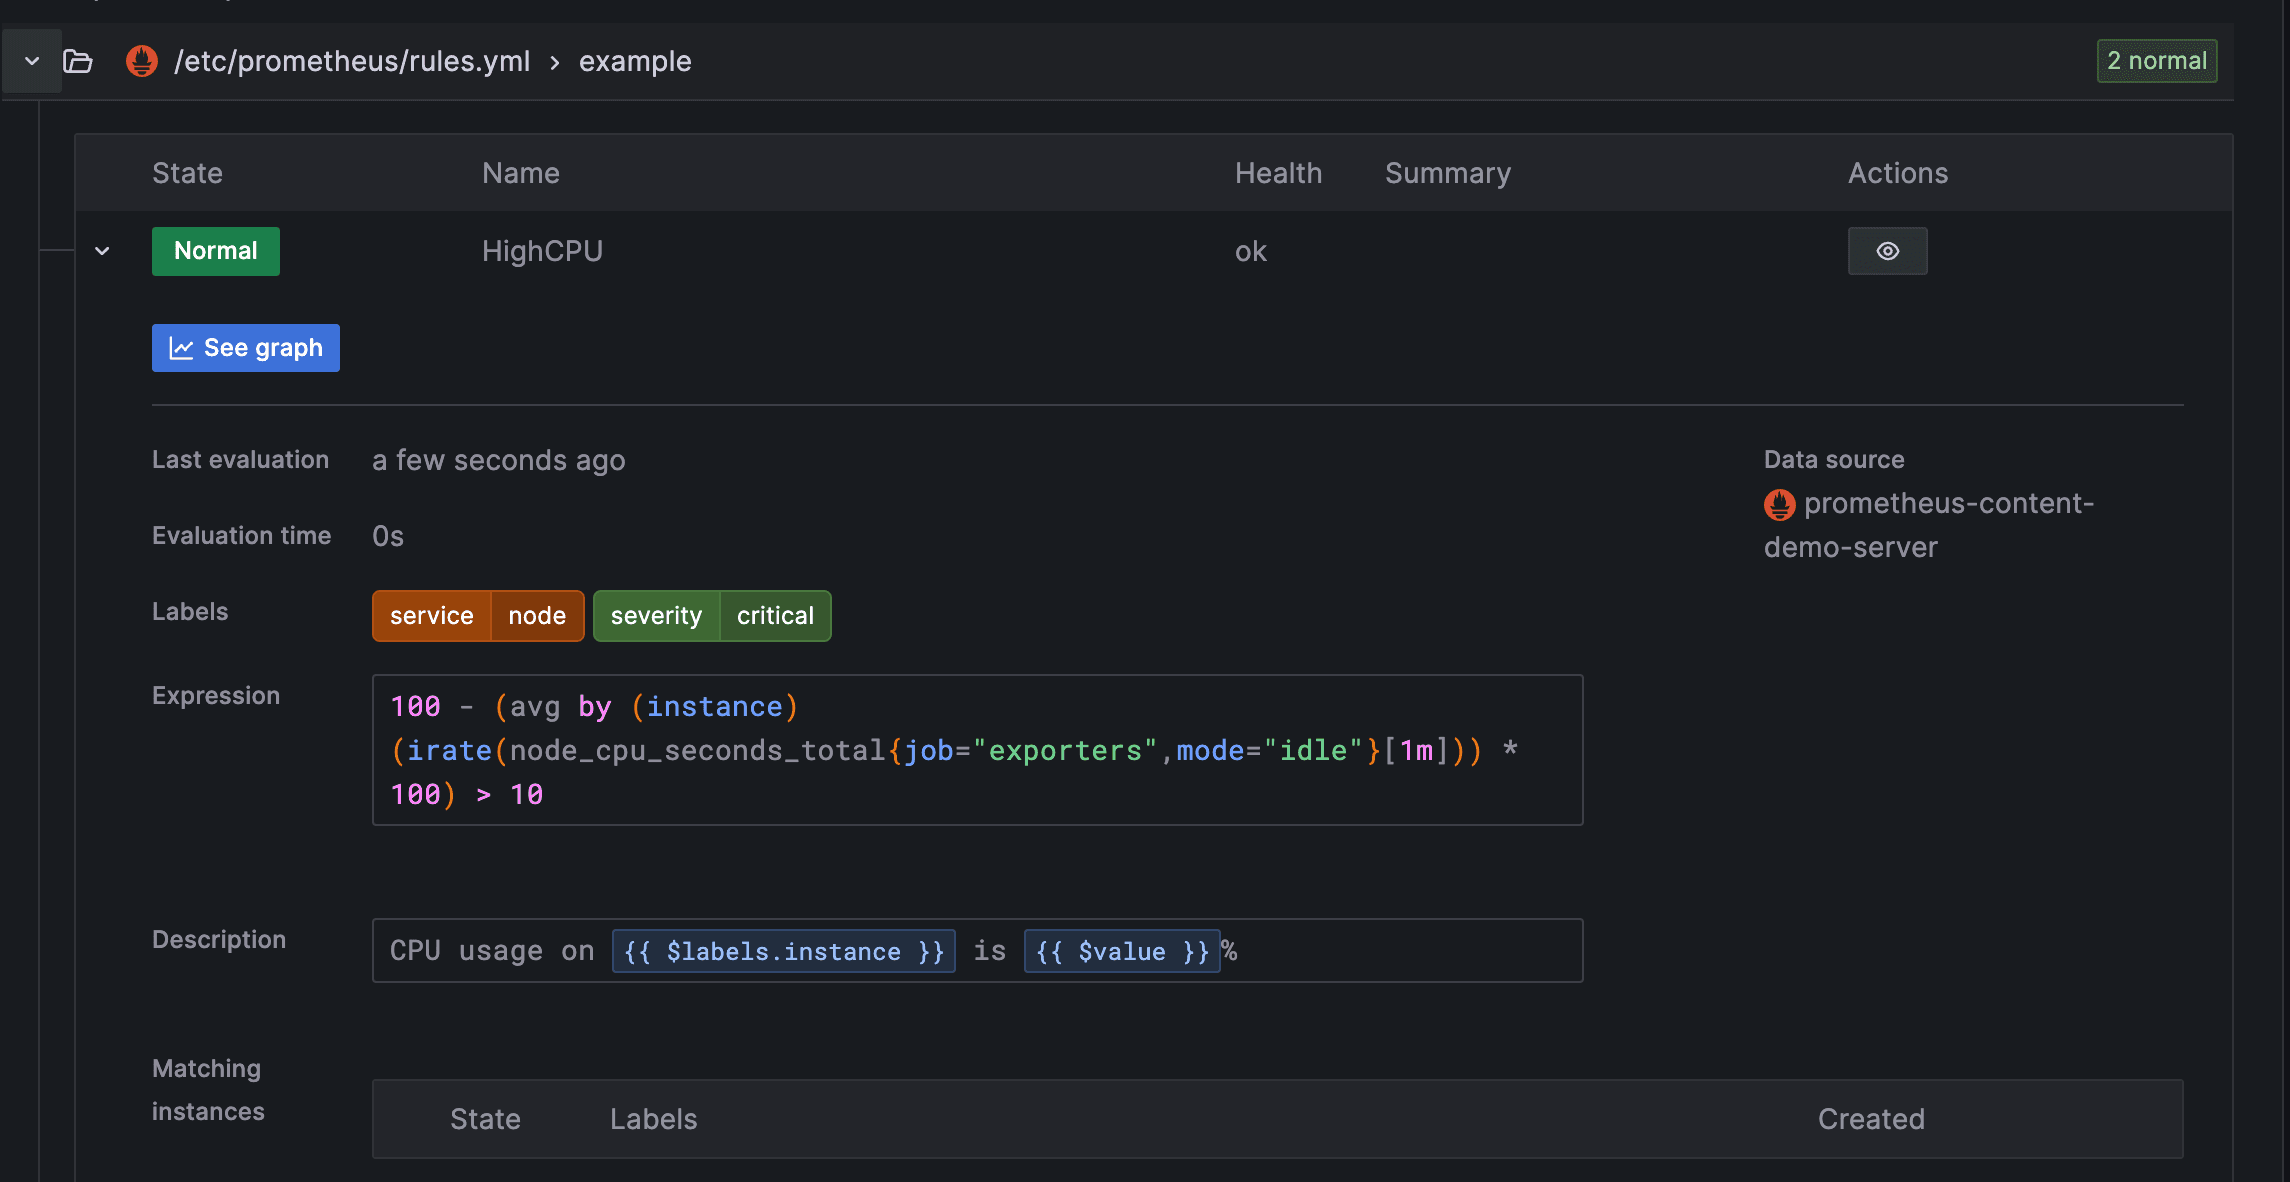
Below is the sample code to trigger the alerts
groups:
- name: example
  rules:
  - alert: HighCPU
    expr: 100 - (avg by (instance) (irate(node_cpu_seconds_total{mode="idle",job="exporters"}[5m])) * 100) > 10
    for: 1m
    labels:
      severity: critical
      service: node
    annotations:
      description: "CPU usage on {{ $labels.instance }} is {{ $value }}%"
  - alert: HighLatency
    expr: rate(http_request_duration_seconds_sum[5m]) / rate(http_request_duration_seconds_count[5m]) > 0.5
    for: 1m
    labels:
      severity: warning
      service: web
    annotations:
      description: "Response time on {{ $labels.instance }} is {{ $value }}s"
Set up AlertManager to forward to n8n
route: receiver: 'n8n-webhook' group_by: ['alertname', 'instance'] group_wait: 30s group_interval: 1m repeat_interval: 30mreceivers:
name: 'n8n-webhook'
webhook_configs:
url: '<http://your-n8n-instance:5678/webhook/prometheus>'
send_resolved: true
Building the n8n Workflow
Now let's create our n8n workflow to process these alerts intelligently:
- Create a Webhook node
- This will receive alerts from AlertManager
- Configure it to parse JSON payloads
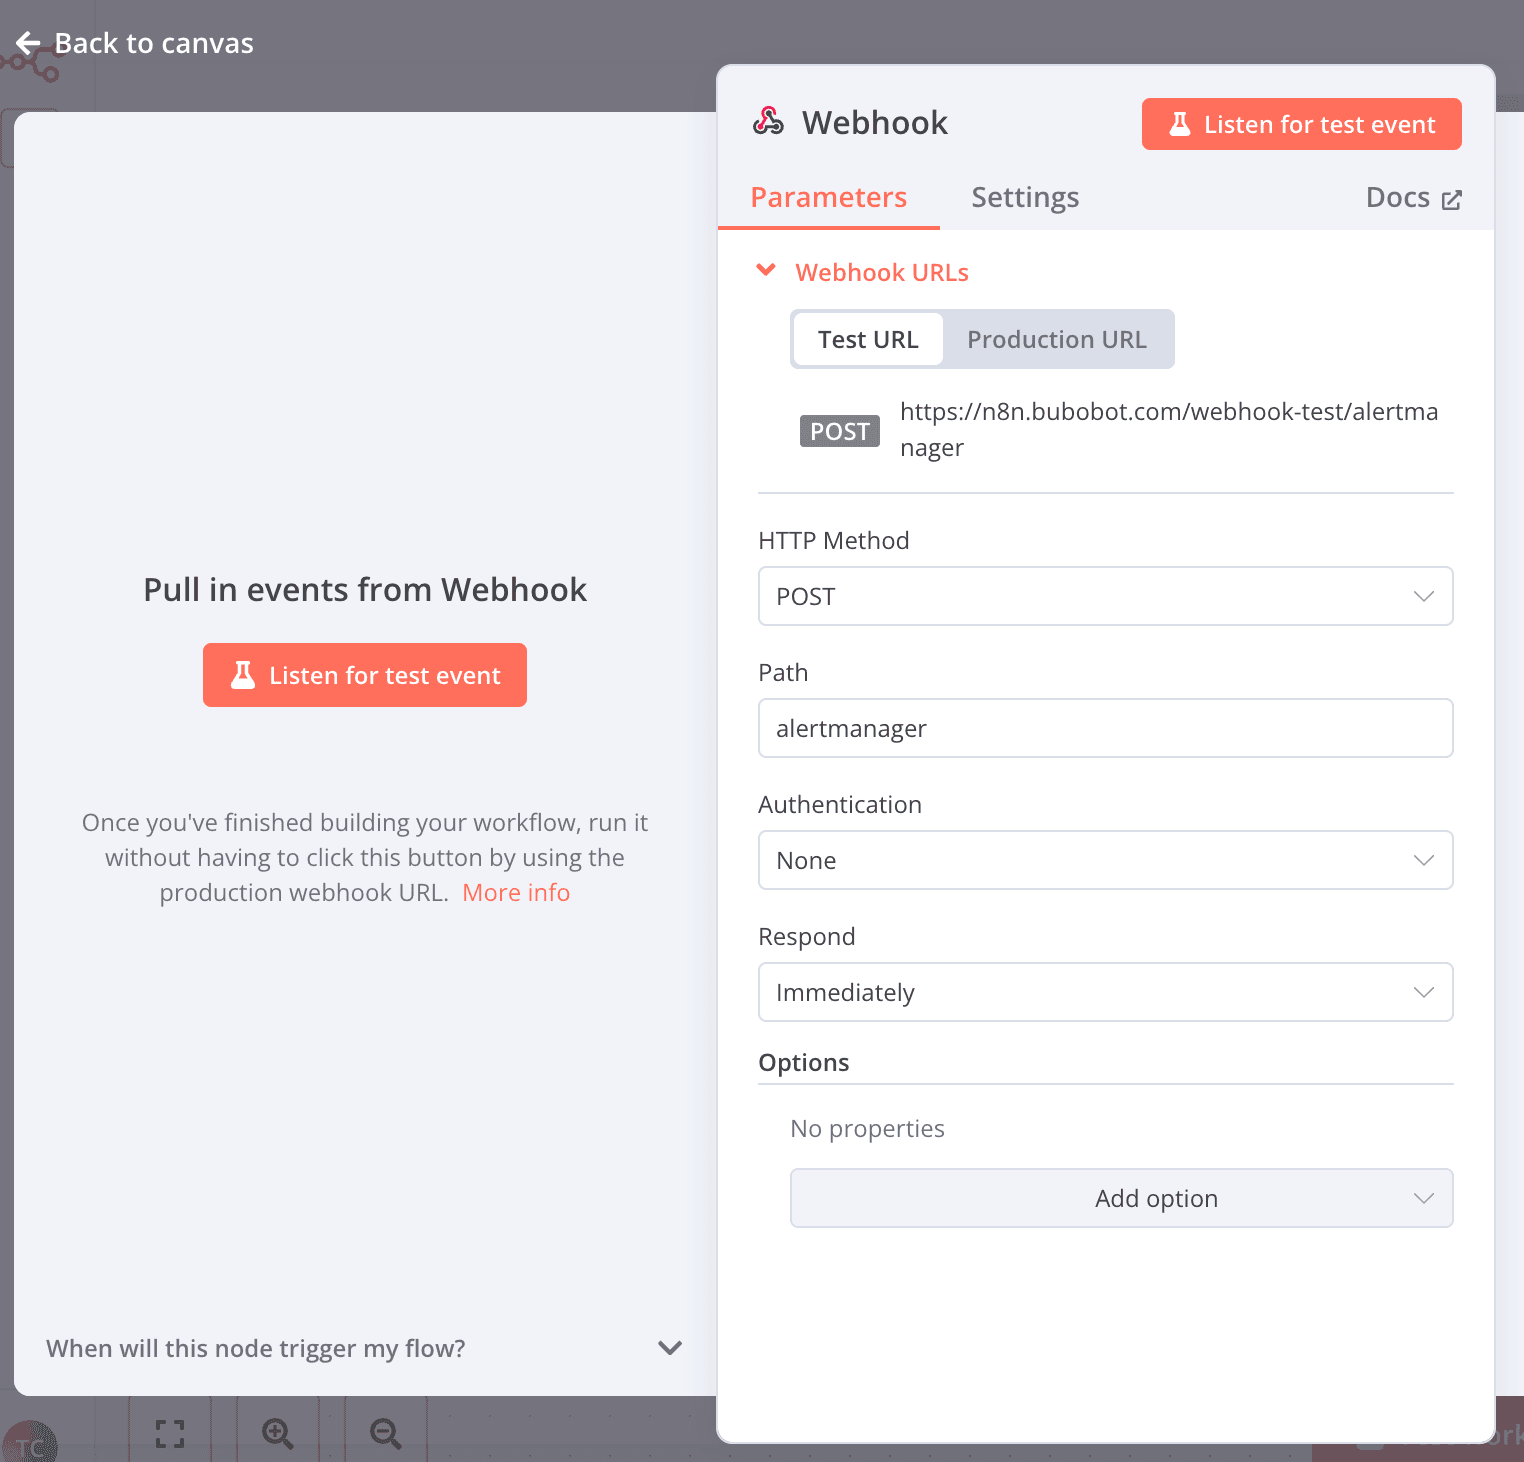
Note: To use "Production URL", you have to set the workflow to "Active"
Add a Function node for alert classification
To analyze the payload by Prometheus, we will try to parse the json. Also, we will calculate the business hour and the duration of the incident, that will help use evaluate the incident better.
Add the code node, input the following Javascript code:
const alerts = items[0].json.body.alerts || []; return alerts.map(alert => ({ const startsAt = new Date(alert.startsAt); const endsAt = new Date(alert.endsAt); const hour = endsAt.getUTCHours(); const isBusinessHours = hour >= 9 && hour < 17; // 9 AM–5 PM UTC const durationMinutes = (endsAt - startsAt) / 1000 / 60; // Duration in minutes json: { status: alert.status, // firing or resolved alertname: alert.labels.alertname, // e.g., HighCPU severity: alert.labels.severity, // e.g., critical instance: alert.labels.instance, // e.g., 47.129.163.27:9100 service: alert.labels.service, // e.g., node description: alert.annotations.description, // e.g., CPU usage description startsAt: alert.startsAt, // e.g., 2025-05-25T06:40:29.682Z endsAt: alert.endsAt, // e.g., 2025-05-25T06:42:59.682Z fingerprint: alert.fingerprint, // e.g., 80e7d055dbb50b48 isBusinessHours: isBusinessHours, // true if within 9 AM–5 PM UTC durationMinutes: durationMinutes // Duration in minutes } }));- Add a Switch node for routing
- Route based on criticality and business hours
- Create three paths:
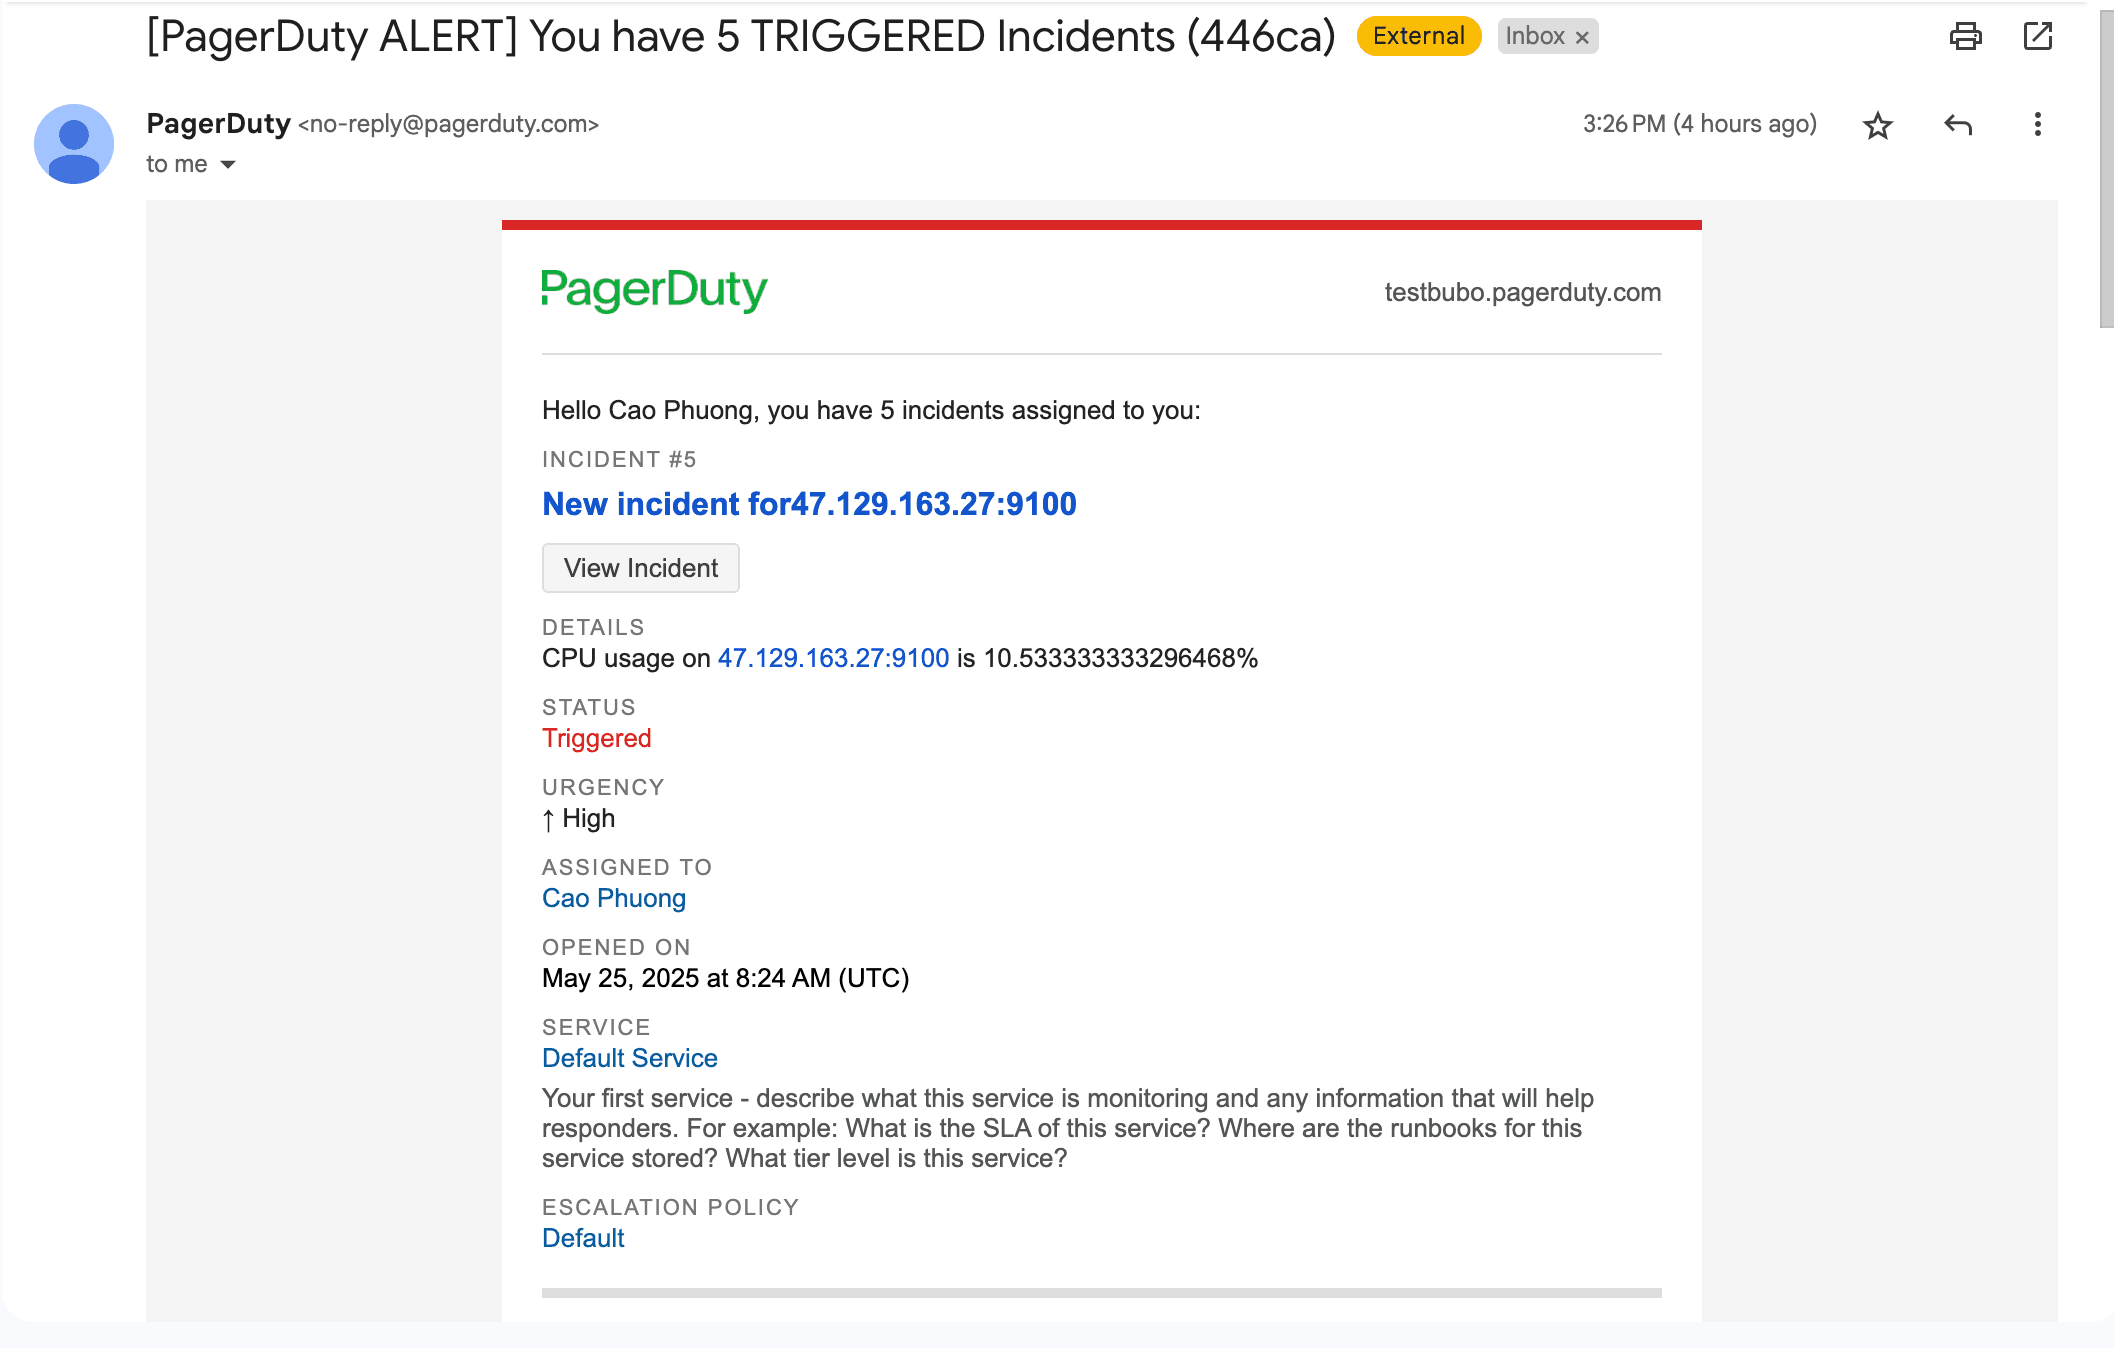
- Critical + After Hours → PagerDuty
- Critical + Business Hours → Discord (urgent channel)
- Non-critical → Discord (general alerts channel)
- Configure service integrations
- PagerDuty node:
- Connect to your PagerDuty service
- Map alert details to incident fields
- Set appropriate urgency
- Discord node:
- Create formatted messages with alert details
- Include links to Grafana dashboards
- Add runbook references if available
- PagerDuty node:
- Add Notion integration for documentation
- Create a Notion database node
- Log all incidents with timestamps, severity, and response details
- Include resolution status and follow-up tasks
When running the above flow, you will routing the alert based on your own defined rules, this is just my example:
Medium alerts are sent to Discord, team can check later.
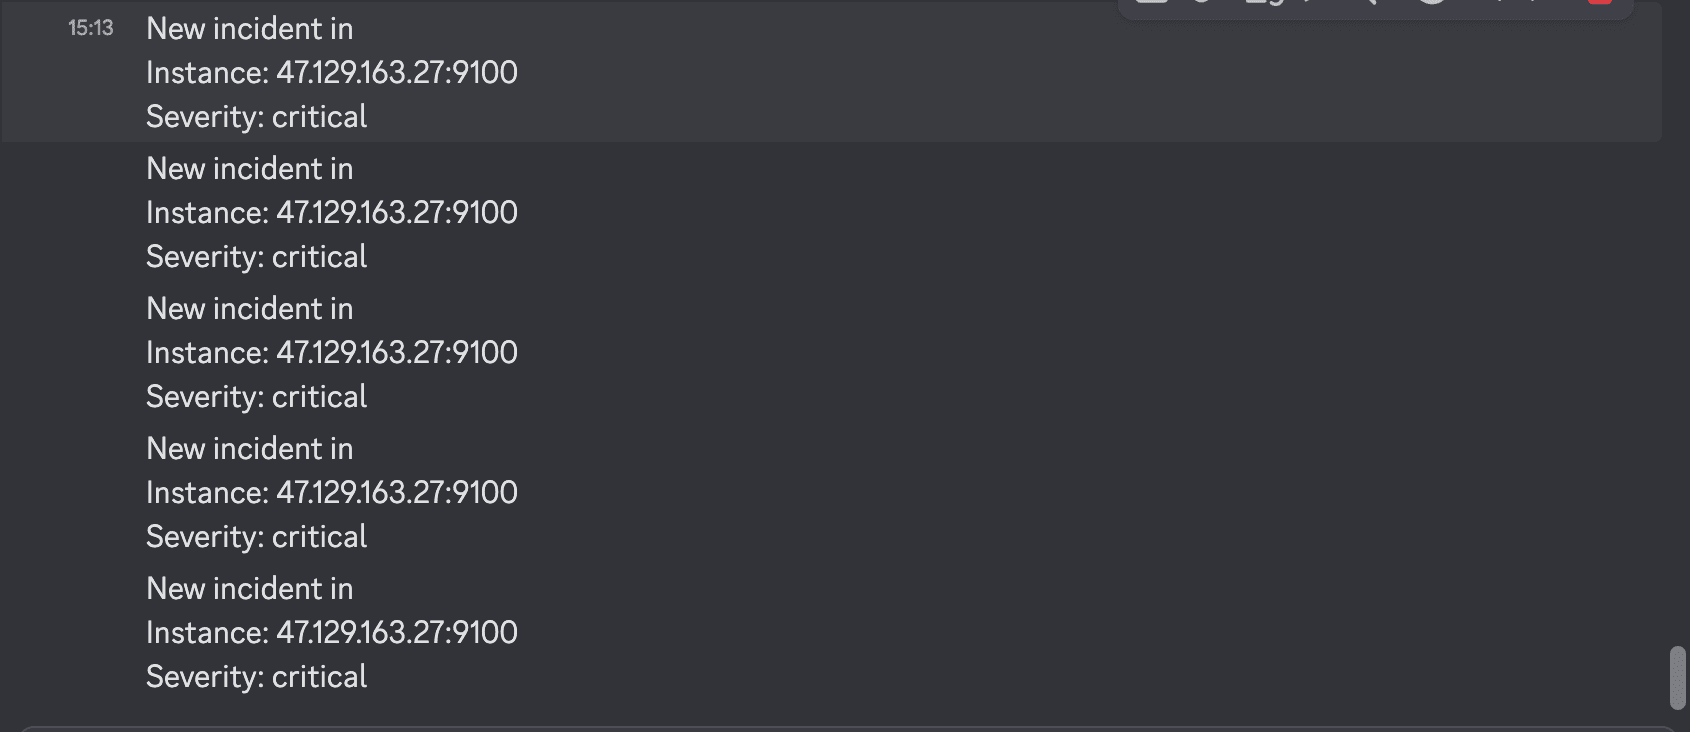
Critical alerts not within business hours or in holidays are sent to PagerDuty, you can configure some calling or escalation rules on PagerDuty's dashboard.
Handle the incident resolution (basic)
Suggested prompt for the AI-agent to handle the context for you:
Analyze the following Prometheus alert to determine if it should be auto-resolved by restarting the EC2 instance to handle issues like high CPU usage, especially when the team is unavailable. The context is:
Alert Name: {{ $node["Code"].json["alertname"] }}
Severity: {{ $node["Code"].json["severity"] }}
Duration: {{ $node["Code"].json.durationMinutes }} minutes
Business Hours: {{ $node["Code"].json["isBusinessHours"] }} (true if 9 AM–5 PM UTC, false otherwise)
Description: {{ $node["Code"].json["description"] }}
Extract the CPU usage (X%) from the description, formatted as: "On <instance> at <alertname>: CPU usage is X%, Memory available is Y%, Swap usage is Z%, Disk I/O is A s, Network received is B MB/s, Latency is C s".
Decide to auto-resolve (restart the EC2 instance) if:
- CPU usage > 80% AND outside business hours (isBusinessHours is false).
- CPU usage > 90% AND duration < 5 minutes.
- Severity is "critical" AND outside business hours (isBusinessHours is false).
Return only the following JSON object, with no additional text, explanations, or markdown:
{
"shouldAutoResolve": boolean,
"reason": "Explanation of the reason why this action should or should not be auto-resolved, referencing CPU usage, duration, severity, and business hours if relevant."
}
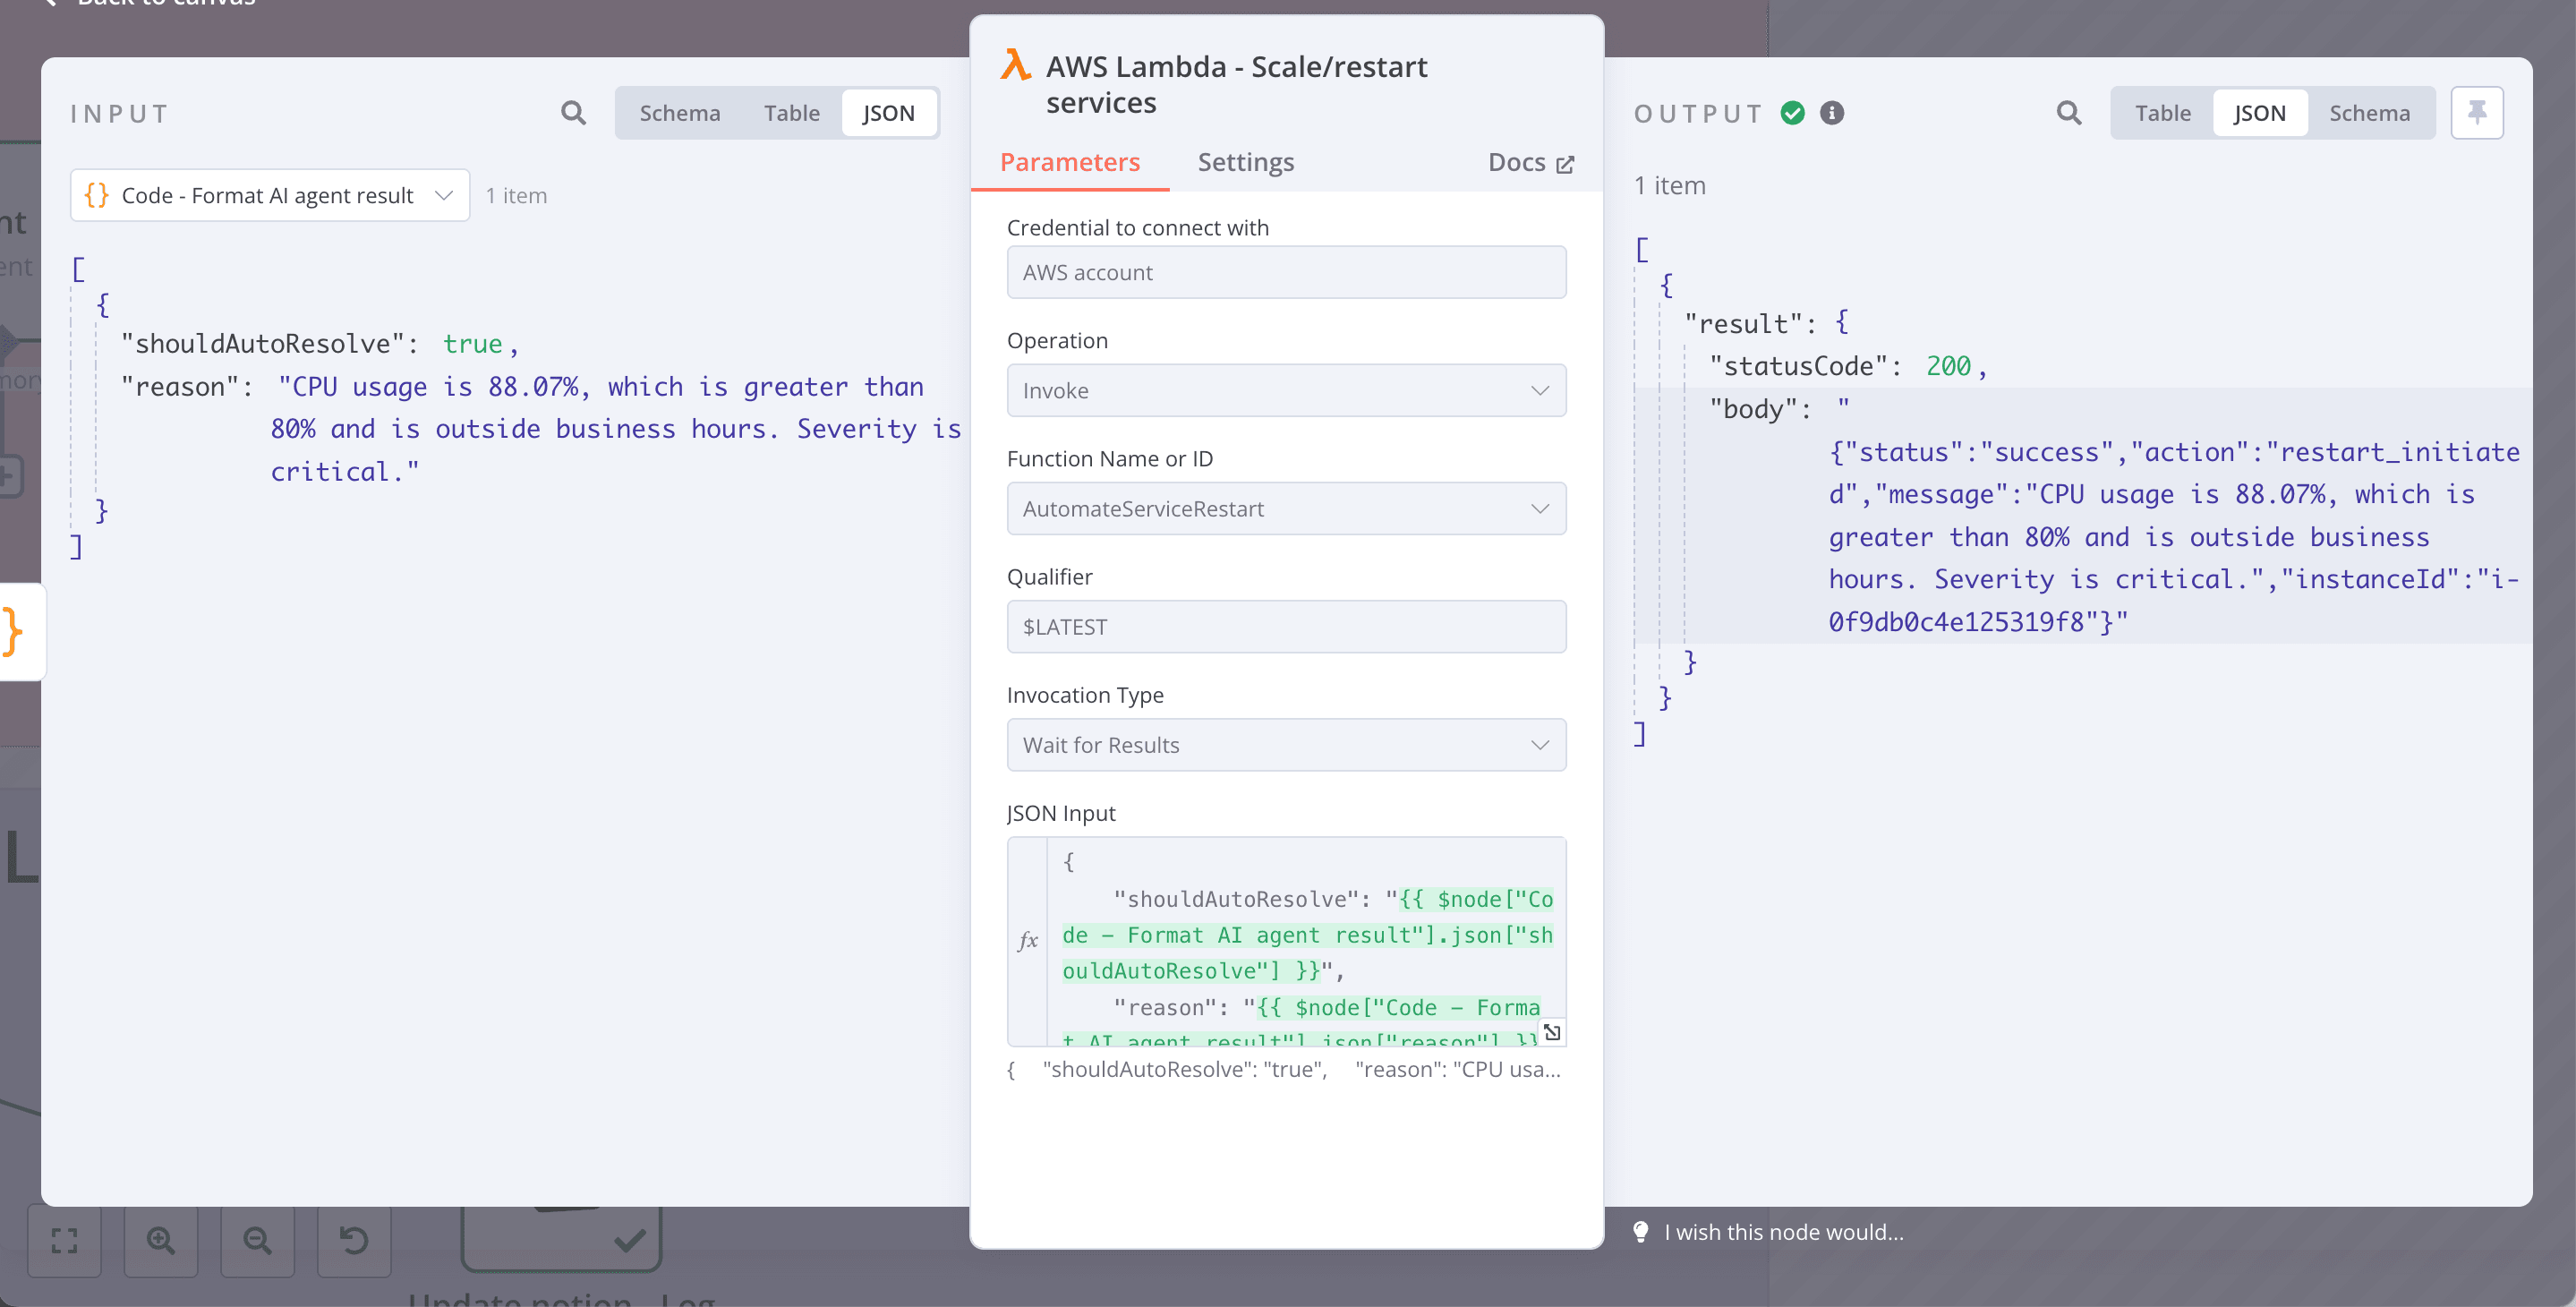
- If shouldAutoResolve is true, a Lambda function will be triggered to restart the EC2 instance.
- If shouldAutoResolve is false, no restart will occur.
- Keep the reason concise and clear, referencing the specific criteria met or not met.
If CPU usage cannot be extracted, assume 0% and include it in the reason.
It will follow your expected context, and decide to execute restart the service or not:
4. Enhancing the Workflow
You can enhance the workflow based on your need, I will recommend some approaches:
The notification phase
N8n support various types of integrations like Slack, Telegram, Rocketchat,...You can integrate whatever you need
The analyzing phase
You can integrate with AI agent node, LLM-chain or OpenLLM, to evaluate the metrics then decider where to route the incidents.
You can improve the workflow much more like:
- Implement smart silencing: By aggregation the metrics from Prometheus alert management, we can use n8n AI node to suppress or escalate the problem to team.
- External dependency checks: We can integrate with some external services like DNS, vercel, AWS,… to make sure the incident is correctly handled.
The logging incidents phase
You can integrate into storing place like GoogleSheet, MongoDB, SQL,... Many database kind are supported
4. Sample codes and workflow
- Incident Response Workflow (json) - https://github.com/Bubobot-Team/automation-workflow-monitoring/blob/main/n8n/n8n___Incident_Response___1.json
- Click-Run deployment of Node Exporter - Prometheus - Alert Manager - Grafana Stack: https://github.com/Bubobot-Team/monitoring-stack/tree/main/stacks/prometheus-stack
Beyond Basic Monitoring: Consider Bubobot
While the Prometheus alert management and n8n integration provides powerful capabilities, organizations with critical uptime requirements may need more comprehensive solutions. Bubobot offers advanced monitoring with the shortest check intervals in the market and AI-enhanced anomaly detection that can identify issues before they trigger traditional thresholds.


