
Let's be real, downtime sucks - nobody wants angry users or middle-of-the-night emergencies when systems crash. Linux command-line tools are your trusty sidekicks for diagnosing and preventing those nasty outages before they spiral out of control.
1. Introduction
Let's be real, downtime sucks. Nobody wants to deal with angry users or scramble to restore service. That's why proactive system health & uptime monitoring are crucial. Linux CLIs are your trusty sidekicks, always ready to help you diagnose and prevent those nasty outages.
Think of them as your go-to tools for a quick system checkup. These lightweight commands are easy to use and give you the immediate feedback you crave. When it comes to Linux monitoring tools and troubleshooting tools, the command line is your friend.
When it comes to Linux monitoring tools and troubleshooting tools, the command line is your friend.
2. Scenario 1: System Down – Time to Investigate!
So, your system crashes. Don't panic! Get it back online ASAP (restart, rollback, whatever it takes). Now, it's time to play detective.
- Key Players:
uptime- See how long your system was up and when it last rebooted. This is fundamental for Linux CLI uptime and CLI uptime troubleshooting.top/htop- A real-time window into your system's soul, showing CPU, RAM usage, and which processes are hogging resources.df -h- Check how much disk space is free. Running out? Uh oh.journalctl- Dive into the system logs. These are like your system's diary, recording events and errors.
- Action Time: Identify any processes going wild with
htop. If you see massive log files clogging up your disk space, useduto find them and then tame them withgzip.
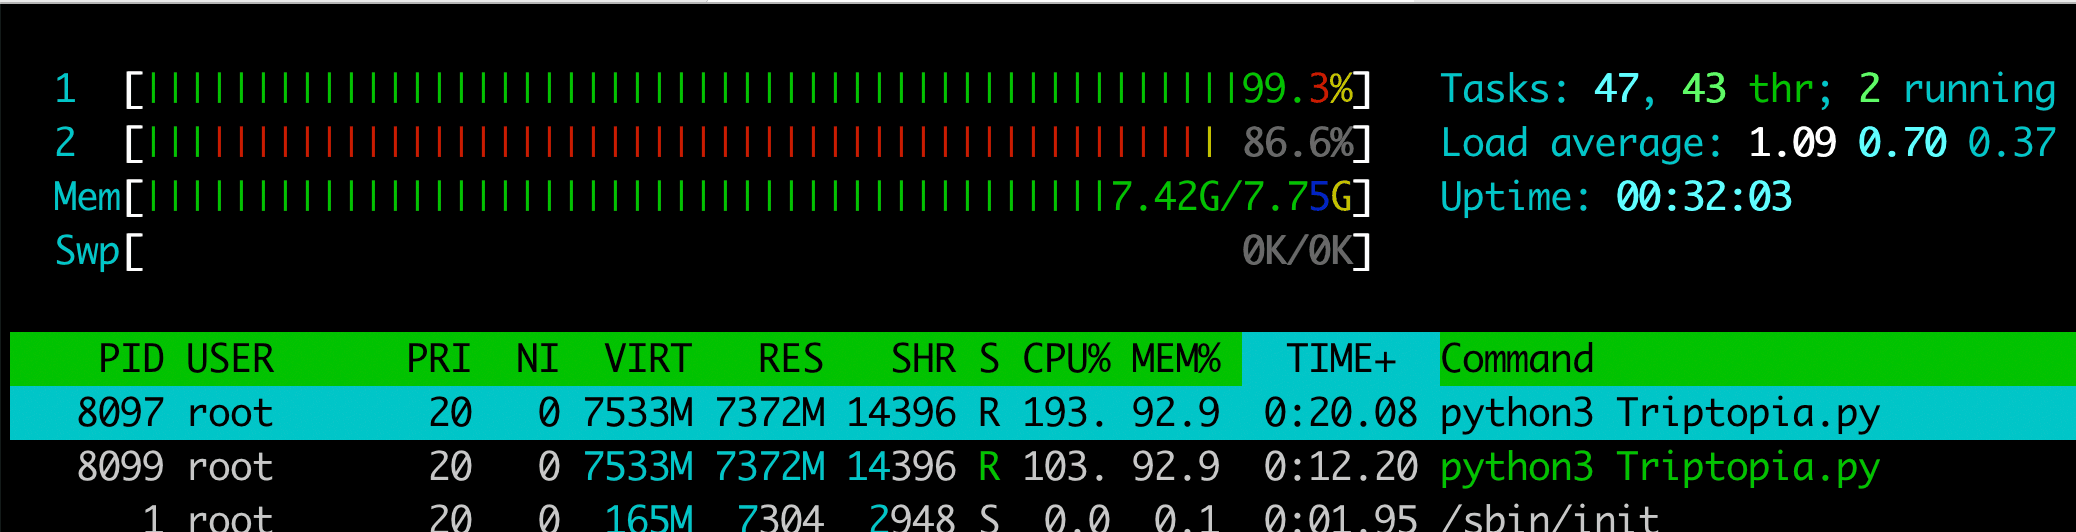
This screenshot from htop shows a system under heavy load.
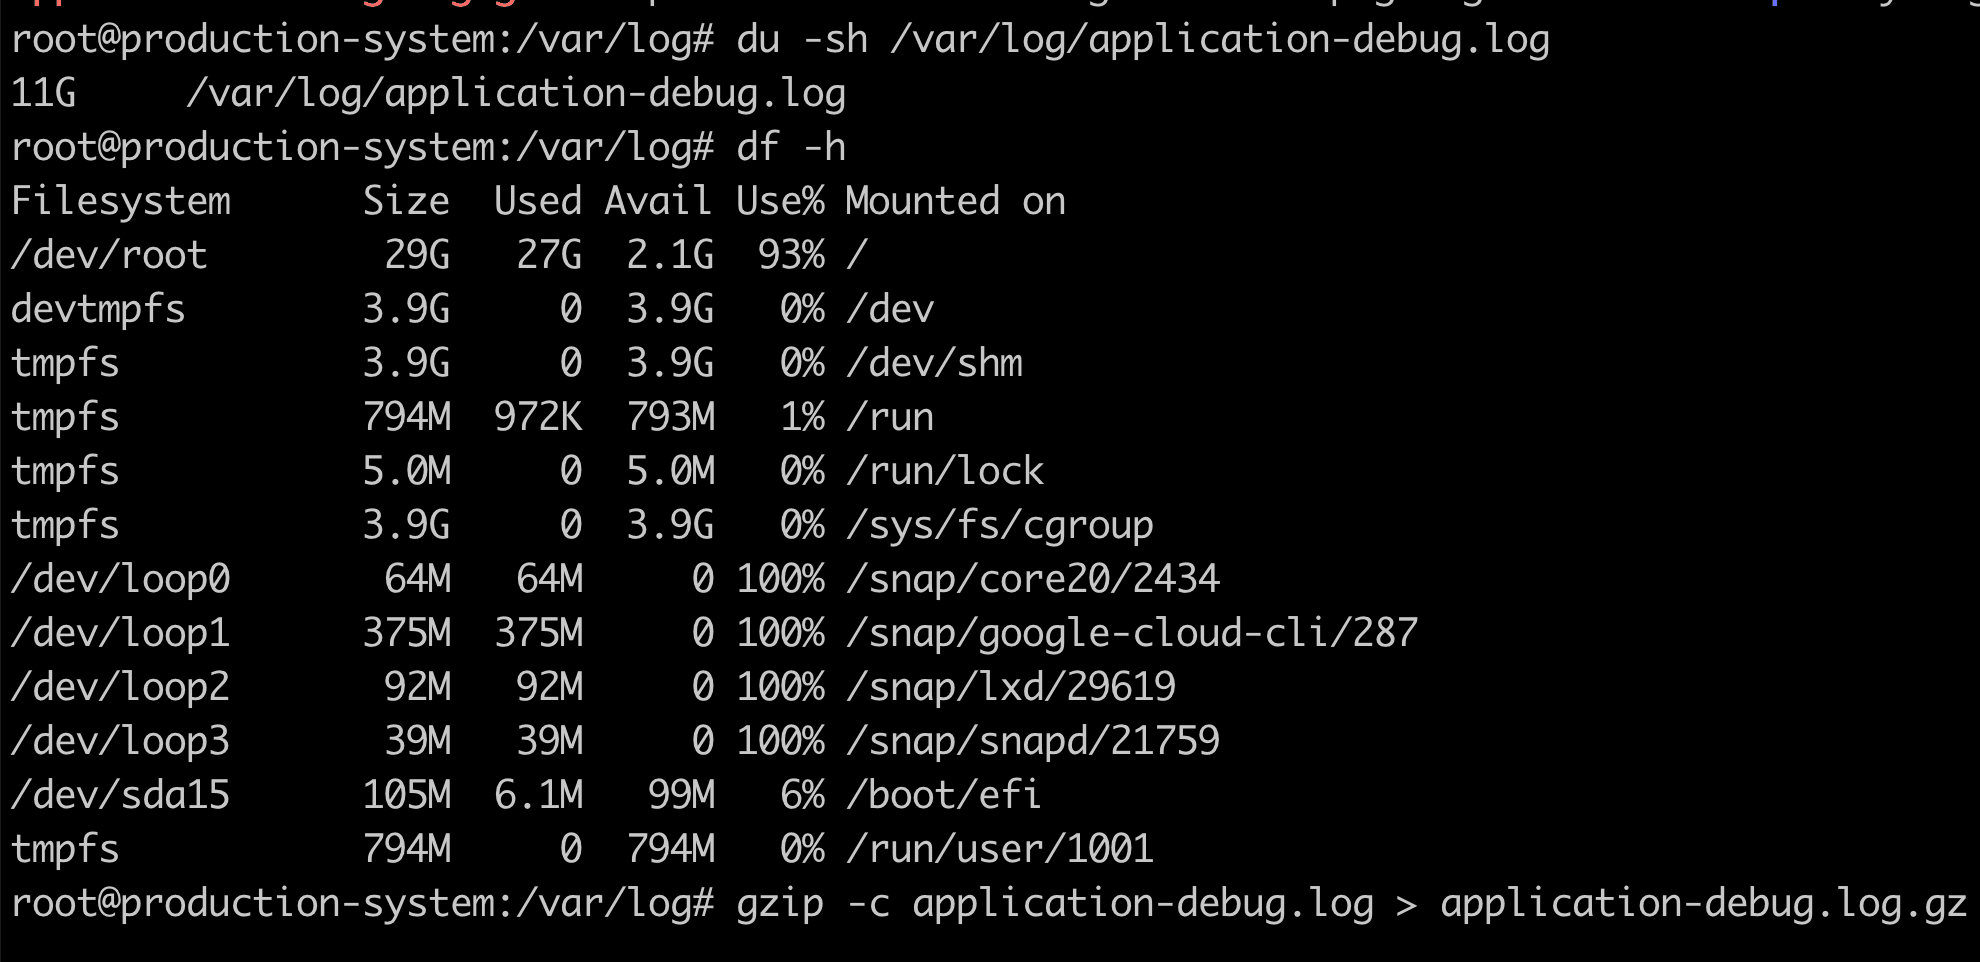
This screenshot highlights a situation where an oversized application log file may cause the server to hang. Using the gzip could help you to resolve the situation.
You're investigating a crash, and you notice a pattern – frequent reboots happening around the same time each day. This is where a tool like Bubobot can be incredibly helpful. By analyzing historical data and identifying recurring patterns, Bubobot can proactively alert you to potential issues before they lead to a full-blown crash.
Proactive monitoring is your insurance policy against major outages. Let's move on to another common scenario...
3. Scenario 2: System Slowdown – Feeling Sluggish?
Your system is feeling sluggish. Pages load slowly, applications are unresponsive. This ain't good.
- Your Investigation Kit:
iostat- Check how fast your disk is reading and writing data.free -h- See how much memory is available.ps aux --sort=-%mem- Find the memory-hungry processes.dstat- A multi-tool that monitors CPU, memory, and disk usage all in one place.
- Time to Take Action: Identify the bottlenecks. Is your CPU overheating? Is memory maxed out? Is your disk struggling to keep up? If you find processes hogging resources, it might be time kill it temporarily to leave (
kill -9). Or, try clearing some cached memory withsync; echo 3 > /proc/sys/vm/drop_caches.
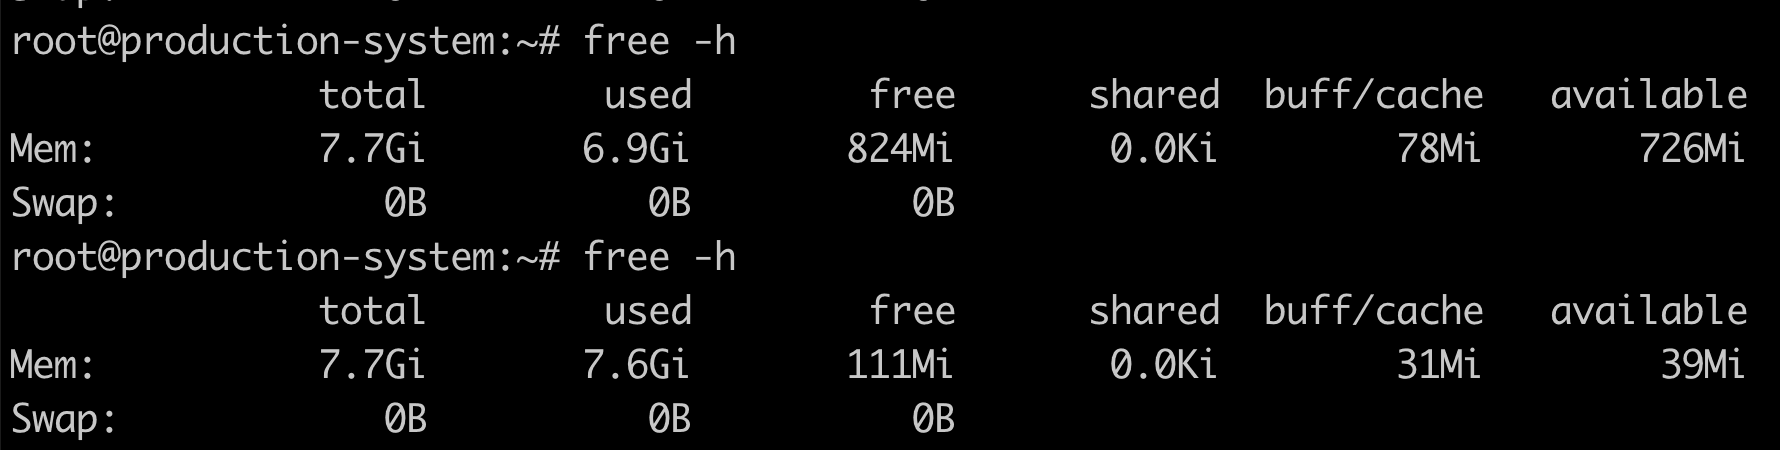
This free -h output demonstrates a system with extremely high memory usage.
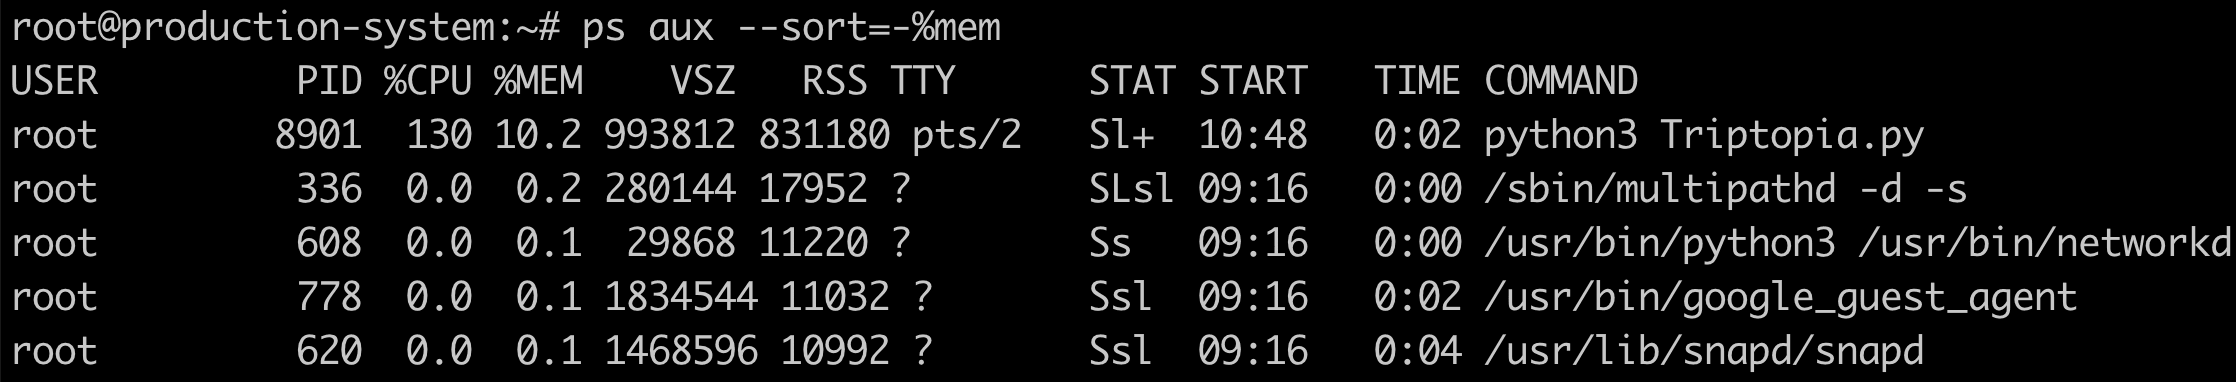
This output from ps aux --sort=-%mem show processes consuming the most memory on the system.
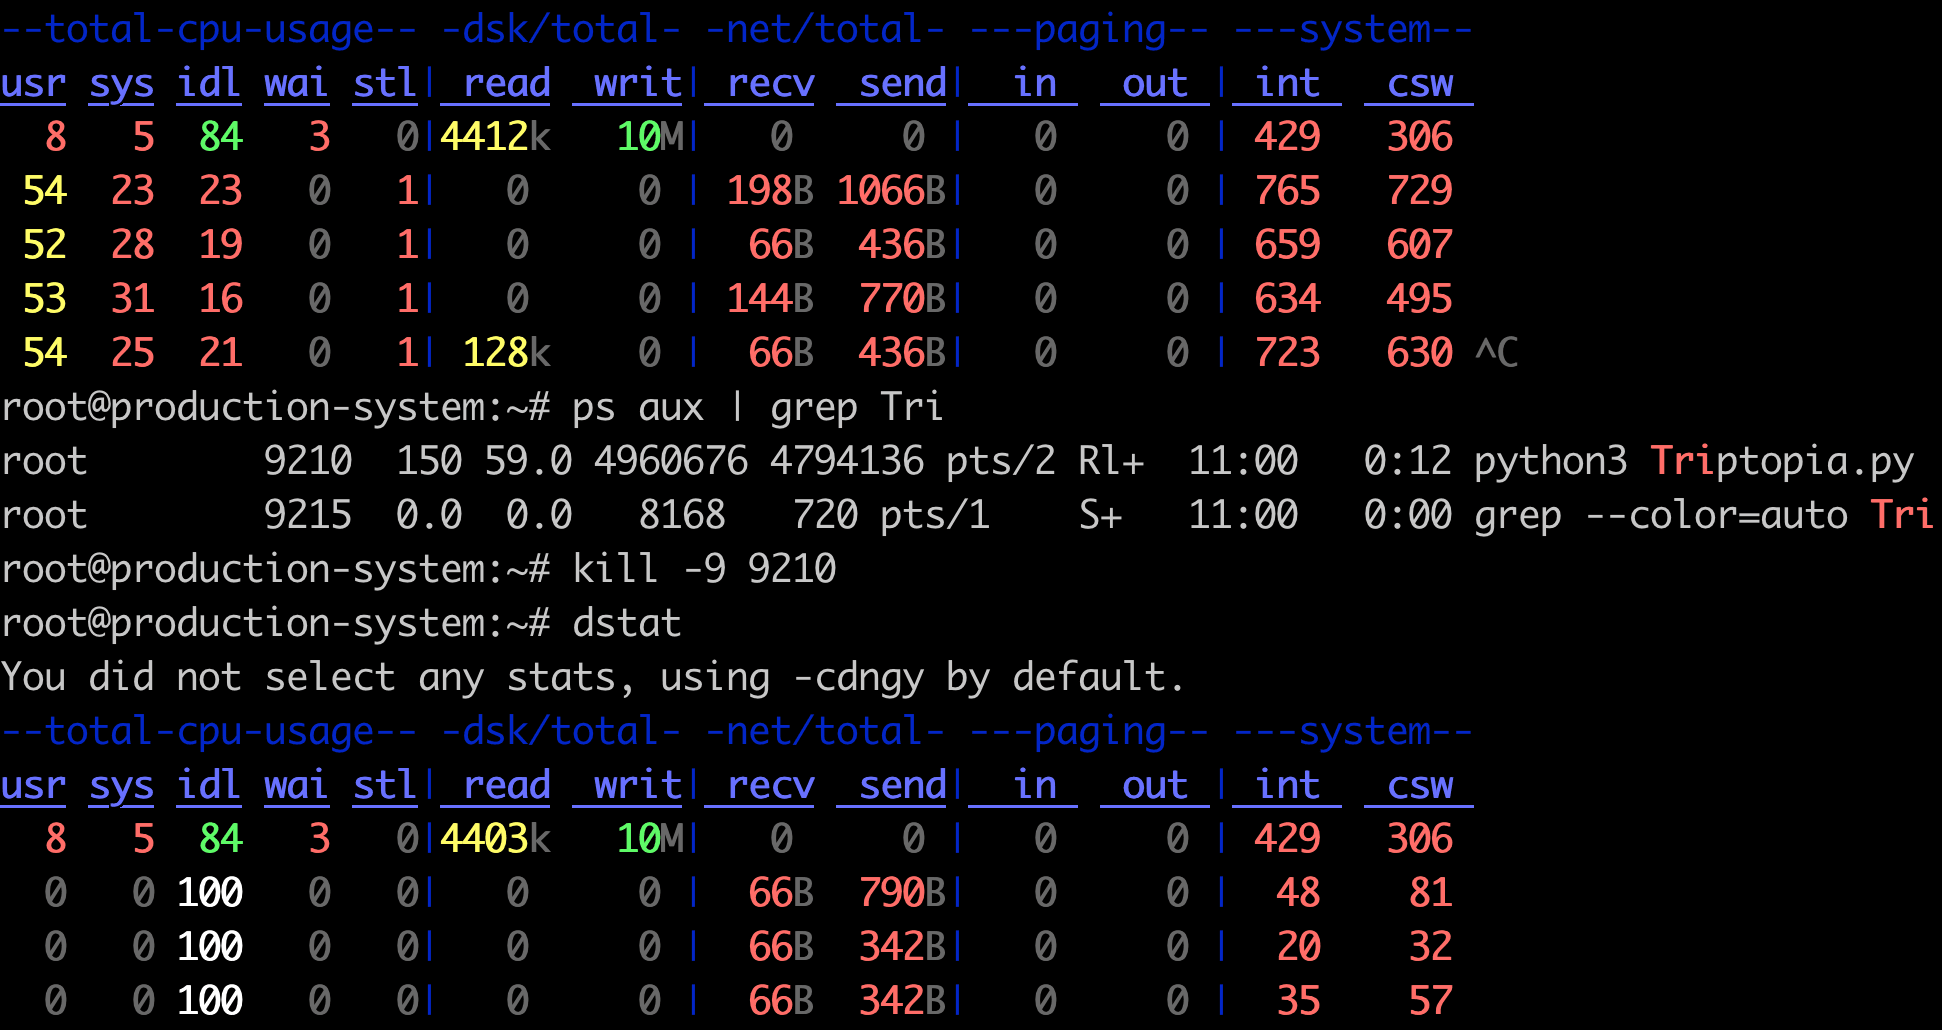
This dstat output provides a real-time snapshot of system performance, including CPU usage, disk I/O, and network activity. You probably try to kill and start the application Triptopia again.
Consistent performance monitoring helps you catch slowdowns before they impact your users. Wouldn't it be awesome to get a heads-up before things go south? Bubobot alerts can do just that, minimizing downtime.
4. Scenario 3: Resource Overload – "Help! I'm drowning!"
<Add visual here> - Something overload (CPU, RAM, Disk)
Imagine this: your system is drowning in a sea of resource requests. CPU usage is soaring, memory is leaking, and disk space is vanishing.
- Your Rescue Squad:
top- Your trusty sidekick for identifying resource-hungry processes.iotop- See which processes are causing the most disk I/O.ncdu- Find those massive files and directories that are eating up all your disk space.
- Time for Damage Control: Identify and restart any misbehaving services. Free up disk space by compressing or deleting unnecessary log files. Analyze resource spikes and report any issues to your development team.
Pro Tip: Don't wait for disaster to happen. Set up automated alerts for critical resource thresholds.
Resource monitoring is your first line of defense against overload-induced meltdowns. Remember to set up automated alerts for critical resource thresholds. You don't want to be caught off guard. Bubobot's automated alerts ensure you're notified about resource issues before they impact critical services.
5. Scenario 5: Peak Demand – Handling the Rush Hour
Your system is about to face a flood of traffic. Will it hold up?
- Your Monitoring Arsenal:
vmstat- Get a snapshot of your system's current performance.sar- Collect and analyze historical resource usage data.uptime- Check the system load average. Is it getting too hot?
- Time to Strategize: Identify potential bottlenecks. Can you scale resources temporarily to handle the increased demand? Optimize resource allocation by adjusting process priorities with
renice.
Proactive scaling ensures your system can handle those peak load times without breaking a sweat.
6. Conclusion
Linux CLIs are your essential toolkit for real-time system health monitoring and troubleshooting. Don't wait for disaster to strike. When it comes to troubleshooting disk errors and ensuring optimal system performance, these tools are invaluable.
Managing system resources effectively is a continuous cycle that follows these critical steps:
- Identify Issues: Using CLI tools like
top,htop, anduptime, you can quickly detect resource-hungry processes and potential system bottlenecks before they impact your services. These tools serve as your first line of defense in spotting trouble. - Analyze Resource Usage: Commands like
iostat,free -h, anddstathelp you determine disk I/O patterns and space usage. This deeper analysis reveals the root causes of performance issues, letting you make informed decisions about system optimization. - Implement Solutions: Whether it's restarting services with high memory usage, managing disk space with
gzip, or adjusting process priorities usingrenice, Linux CLIs give you the power to take immediate corrective action. - Set Up Alerts: While manual monitoring is valuable, automated monitoring is essential for 24/7 system health. Tools like Bubobot can provide real-time alerts and detect anomalies before they escalate into critical issues.
While Linux CLIs are your trusty sidekicks, an automated uptime monitoring platform like Bubobot can supercharge your uptime strategy. Bubobot's, a free uptime monitoring, with alerting and anomaly detection features provide that extra layer of protection, ensuring you're always in the know.
For more CLI-based monitoring tips, check out our guide on Monitoring SSL Certificate Expiry with CLI https://bubobot.com/blog/linux-cl-is-for-system-health-prevent-downtime-ensure-uptime
#SystemMonitoring #LinuxCLI #BetterUptime


