
While server uptime monitoring tells you when systems are available, it misses what's happening inside your database, where real performance bottlenecks often hide.
Your servers show green, your website responds, but users are complaining about slow checkout times.
While server uptime monitoring tells you when systems are available, it misses what's happening inside your database, where the real performance bottlenecks often hide. For companies running critical applications, this blind spot can cost thousands in lost revenue before you even know there's a problem.
1. The Database Blind Spot in Monitoring
Most monitoring strategies focus on the obvious stuff—is the server up, is the website responding, are the ports open. But here's what they miss: your database could run on inefficient queries while your uptime monitoring dashboard may show everything's up.
Why Uptime Monitoring Isn't Enough
Traditional web uptime monitoring operates at the surface level. It pings your homepage, checks if your API endpoints return 200 status codes, and calls it good. But think about what actually happens when a user tries to complete a purchase:
- The web server receives the request (✅ monitored)
- The application processes the logic (✅ maybe monitored)
- The database executes complex queries involving inventory, pricing, and user data (❌ not monitored)
- Results return to display the page (✅ monitored)
See the gap? That third step—where most performance issues actually occur—is completely invisible to uptime monitoring tools.
The Hidden Costs
Consider this scenario: Your e-commerce site loads in 2 seconds instead of 500ms because of an inefficient inventory query. Server uptime monitoring shows 100% availability, but conversion rates drop 15% because users abandon slow-loading pages.
When "Green" Status Masks Critical Issues
Here's a real-world example that'll make you rethink your monitoring strategy:
A SaaS platform with 1,000 users started experiencing complaints about dashboard loading times. Their uptime monitoring software showed perfect 99.99% availability. The problem? A poorly optimized database query was taking 8 seconds to aggregate user analytics data. The homepage still loaded fine (monitored), the API health check still returned quickly (monitored), but the core user experience was degrading rapidly (completely invisible).
The fix took 10 minutes once they identified the query. Finding the problem took three weeks of user complaints and manual investigation.
Key Takeaway: Your monitoring stack isn't complete until it includes database performance monitoring—because uptime without performance is just an expensive illusion.
2. Essential Database Performance Metrics
For database performance, it's about focusing on the indicators that directly impact user experience and business outcomes. I list some important metrics in the table below:
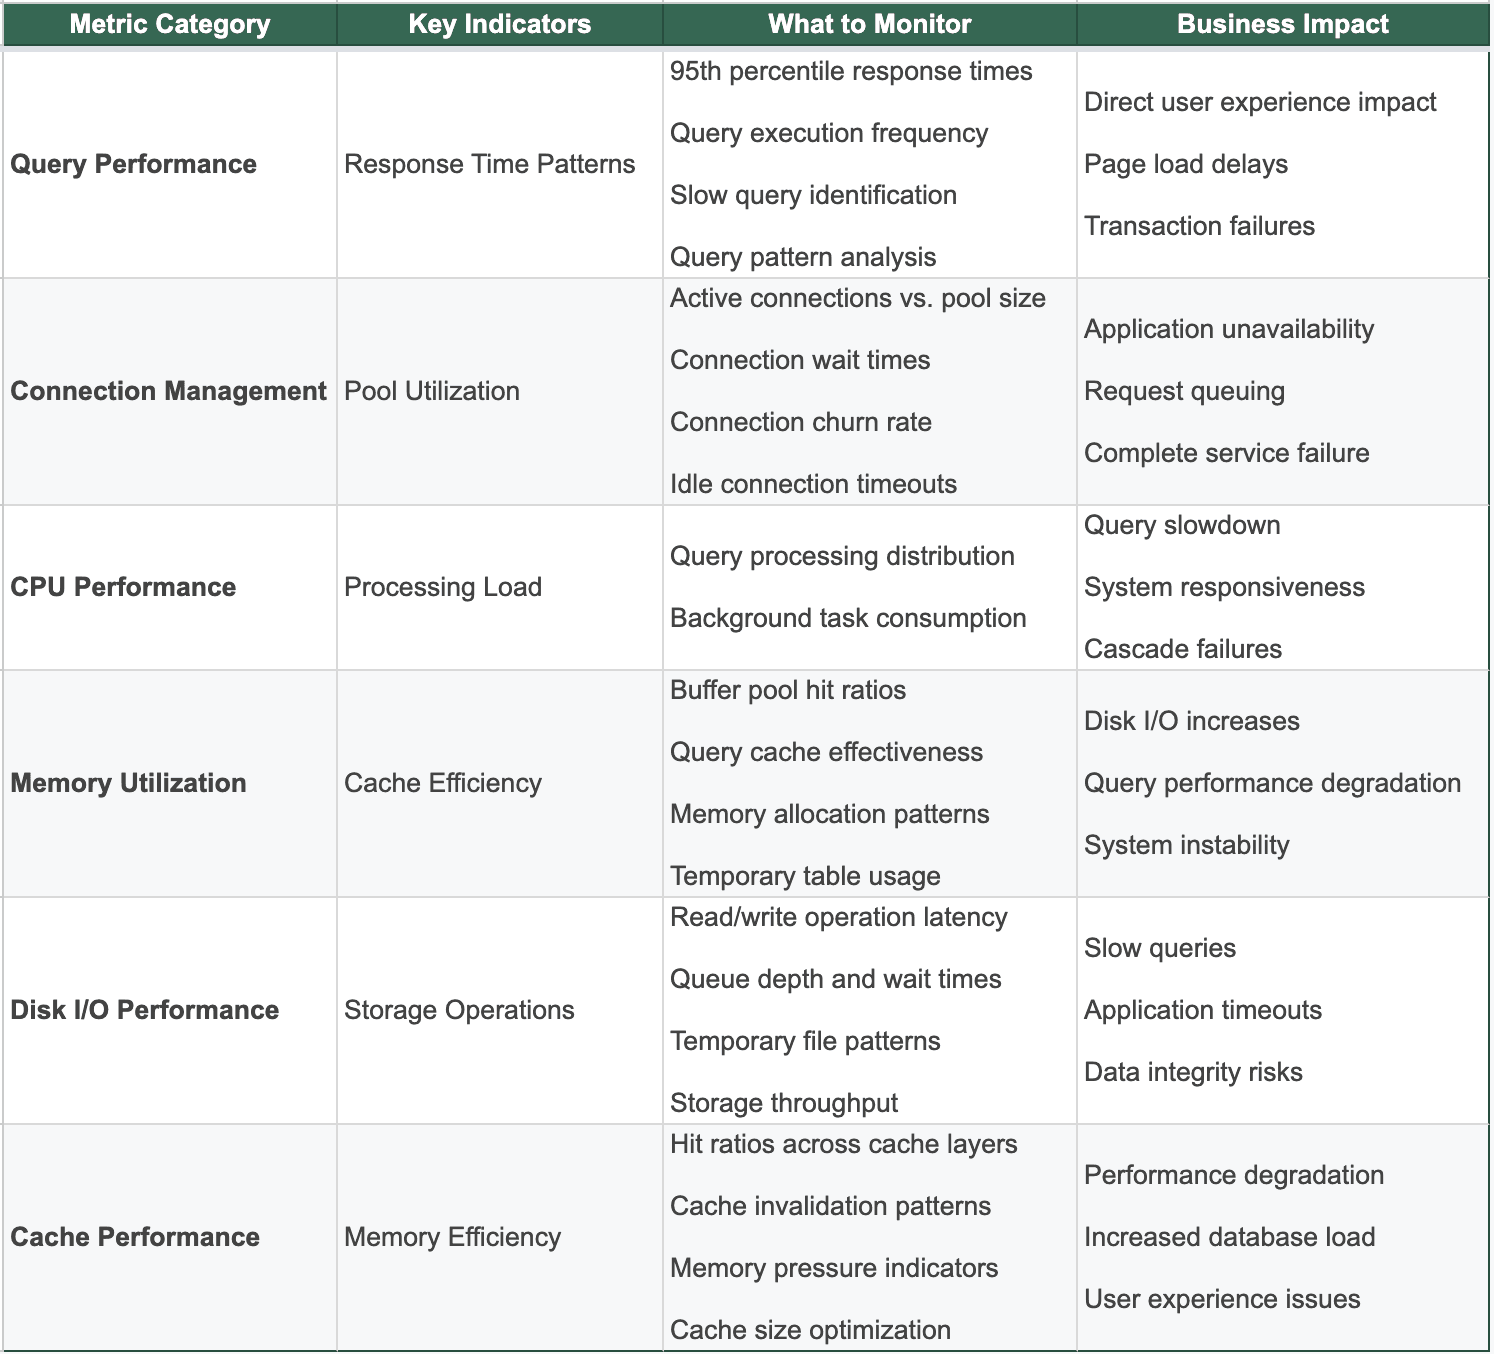
Key Takeaway: Focus on metrics that predict user experience degradation, not just system health—because a technically healthy database can still deliver terrible performance.
3. Best Practices for Database Performance Monitoring
Effective database monitoring isn't about collecting all data—it's about collecting the right data and acting on it intelligently.
Setting Meaningful Baselines and Thresholds
Generic monitoring thresholds don't work for databases because performance is highly contextual. A query that takes 500ms during off-peak hours might be acceptable, but the same query taking 500ms during peak traffic indicates a serious problem.
Establish Dynamic Baselines:
- Track performance patterns by time of day, day of week, and seasonal trends
- Set different thresholds for peak vs. off-peak periods
- Account for business cycle variations (month-end processing, holiday traffic)
- Adjust baselines quarterly based on growth patterns
Context-Aware Alerting: Instead of alerting when CPU hits 80%, alert when CPU usage exceeds the 95th percentile for that specific time period over the last 30 days. This eliminates false positives during expected high-traffic periods while catching genuine anomalies.
Correlating Database Metrics with Infrastructure Monitoring
The effective database performance monitoring strategies correlate database metrics with broader server uptime monitoring data to identify root causes faster.
Cross-Layer Correlation Examples:
- Slow query spikes + increased disk I/O wait times = storage bottleneck
- Connection pool exhaustion + normal CPU usage = application connection leaks
- Memory pressure + increased swap usage = insufficient memory allocation
- Query timeouts + network latency spikes = infrastructure connectivity issues
Set up monitoring dashboards that display database performance alongside network, storage, and application metrics. When issues occur, you'll immediately see whether the problem is database-specific or part of a broader infrastructure issue.
Creating Noise-Reducing Alert Strategies
Database systems generate tons of performance data, but most of it isn't actionable. Effective alerting focuses on business impact, not technical curiosities. You should implement a smart alert like:
- Only alert on sustained performance degradation (5+ minutes) rather than temporary spikes
- Group related alerts (connection issues + slow queries = single incident)
- Suppress redundant alerts during known maintenance windows
- Use escalation policies that account for incident severity and business hours
Multi-Database Platform Monitoring
Most companies use multiple database technologies, each with unique performance characteristics. Your uptime monitoring software should handle this diversity without requiring separate tools for each platform.
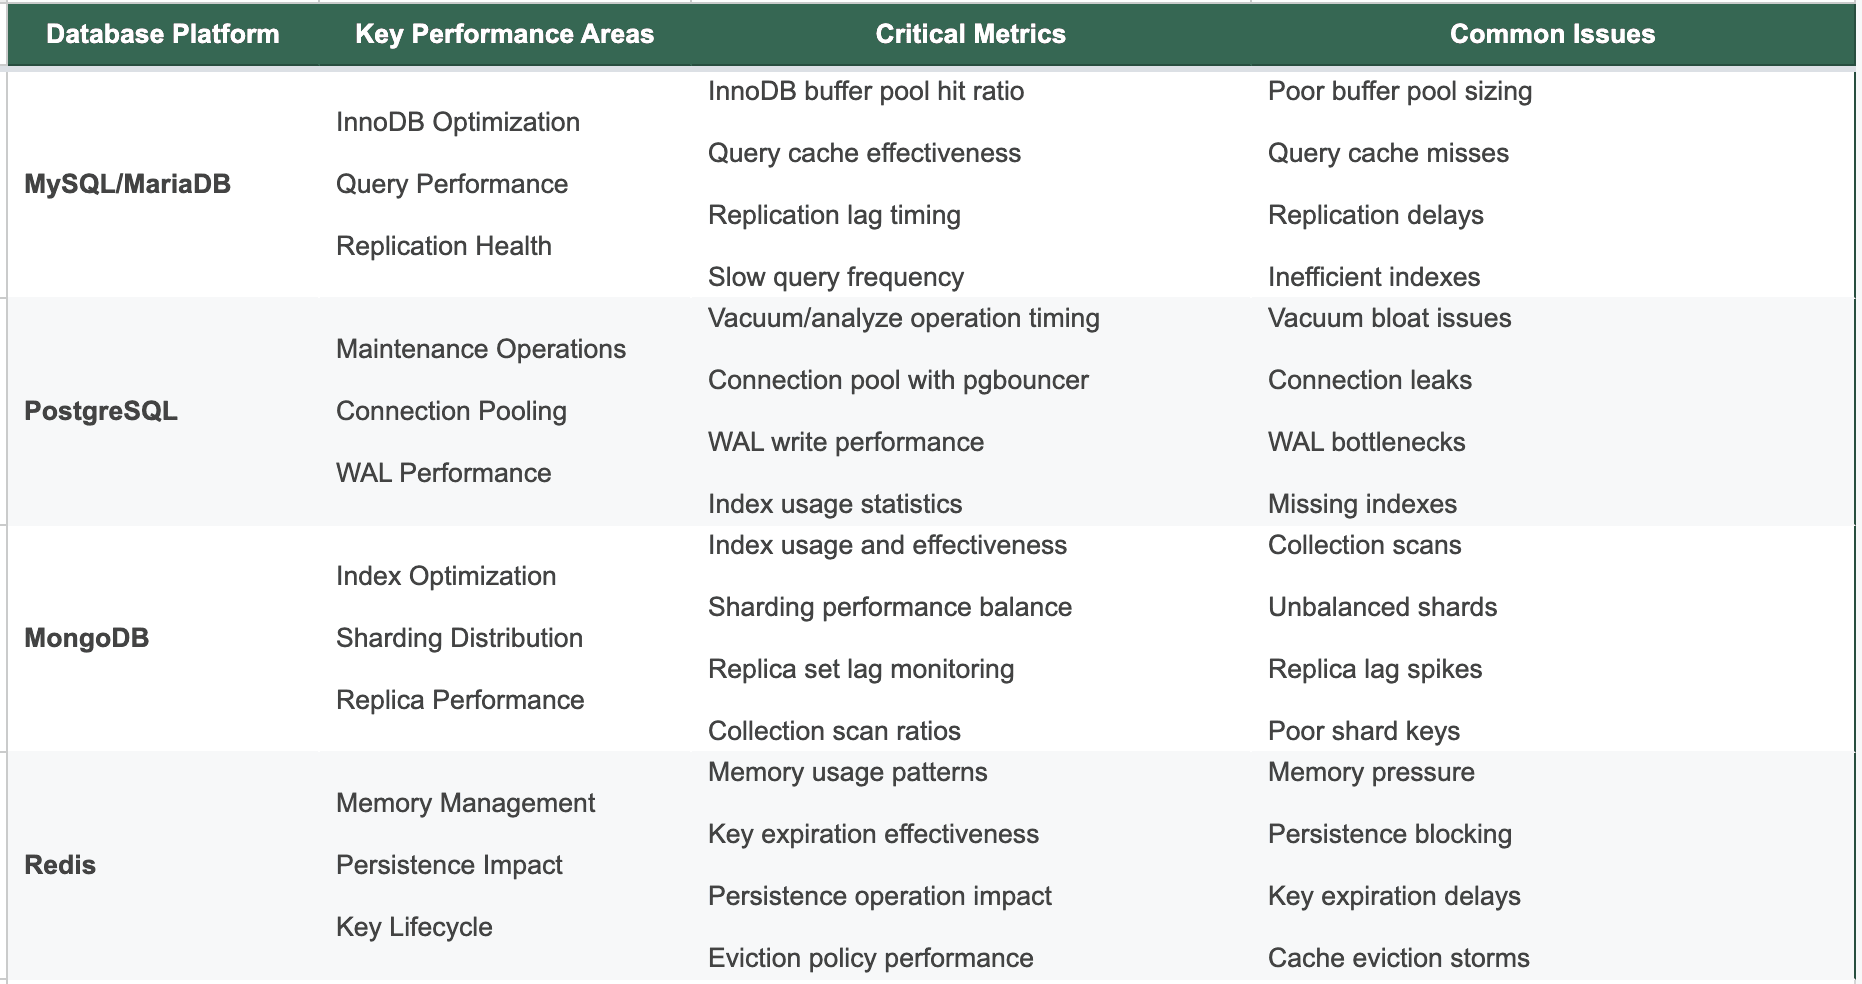
Key Takeaway: Effective database monitoring requires understanding each platform's unique performance characteristics while maintaining a unified view of overall system health.
4. Solutions for Database Performance Monitoring
When it comes to database monitoring, you have two main paths: traditional heavyweight monitoring tools or lightweight heartbeat-based approaches that integrate seamlessly with your existing uptime monitoring tools.
Traditional vs. Lightweight Monitoring Approaches
Traditional Database Monitoring Tools: These enterprise solutions offer comprehensive dashboards and deep analytics but come with significant overhead:
- Require agent installation on database servers
- Consume CPU and memory resources constantly
- Complex configuration and maintenance requirements
- Vendor lock-in with proprietary data formats
Lightweight Heartbeat Monitoring: This approach leverages your existing server uptime monitoring infrastructure to track database health without additional overhead:
- No permanent agents or resource consumption
- Custom scripts that run on-demand and report via heartbeat signals
- Flexible implementation that adapts to your specific needs
- Cost-effective scaling as your infrastructure grows
Heartbeat-Based Database Health Monitoring
Here's how to implement effective database performance monitoring using heartbeat endpoints—a method that works with virtually any uptime monitoring software that supports custom HTTP checks.
Core Implementation Strategy:
Create lightweight scripts that test database performance and report results via HTTP heartbeat calls. These scripts run periodically (every 1-5 minutes) and send success/failure signals to your monitoring platform along with performance metrics.
Sample MySQL Performance Check Script:
#!/bin/bash # MySQL performance heartbeat checkConfiguration
DB_HOST="localhost" DB_USER="monitor_user" DB_PASS="your_password" HEARTBEAT_URL="<https://uptime-api.bubobot.com/api/heartbeat/xxx>"
Performance test query
QUERY_START=$(date +%s%3N) RESULT=$(mysql -h$DB_HOST -u$DB_USER -p$DB_PASS -e "SELECT COUNT(*) FROM your_main_table WHERE created_at > NOW() - INTERVAL 1 HOUR;" 2>&1) QUERY_END=$(date +%s%3N)
Calculate response time
RESPONSE_TIME=$((QUERY_END - QUERY_START))
Check if query succeeded and response time is acceptable
if [[ $? -eq 0 ]] && [[ $RESPONSE_TIME -lt 2000 ]]; then # Success - send heartbeat with performance data curl -X POST "$HEARTBEAT_URL" \ -H "Content-Type: application/json" \ -d "{\"status\":\"success\",\"response_time\":$RESPONSE_TIME,\"timestamp\":\"$(date -Iseconds)\"}" else # Failure - send alert with error details curl -X POST "$HEARTBEAT_URL" \ -H "Content-Type: application/json" \ -d "{\"status\":\"failure\",\"error\":\"$(echo $RESULT | tr '\"' '\\\"')\",\"response_time\":$RESPONSE_TIME}" fi
PostgreSQL Connection Pool Monitoring:
#!/bin/bashPostgreSQL connection monitoring
Check active connections vs. max connections
ACTIVE_CONN=$(psql -h localhost -U monitor_user -d your_db -t -c "SELECT count(*) FROM pg_stat_activity WHERE state = 'active';") MAX_CONN=$(psql -h localhost -U monitor_user -d your_db -t -c "SHOW max_connections;")
Calculate utilization percentage
UTILIZATION=$((ACTIVE_CONN * 100 / MAX_CONN))
Alert if utilization exceeds 80%
if [[ $UTILIZATION -lt 80 ]]; then curl -X POST "$HEARTBEAT_URL" -d "{\"status\":\"success\",\"connection_utilization\":$UTILIZATION}" else curl -X POST "$HEARTBEAT_URL" -d "{\"status\":\"warning\",\"connection_utilization\":$UTILIZATION,\"message\":\"High connection utilization\"}" fi
Implementation Benefits and Best Practices
Resource Efficiency: Heartbeat scripts only consume resources when they run (typically 30-60 seconds per day total), unlike permanent monitoring agents that continuously consume CPU and memory.
Customization Flexibility: You can monitor exactly what matters to your business—specific query patterns, custom performance metrics, or business-logic-dependent health checks that generic tools can't provide.
Integration Simplicity: Works with any uptime monitoring tools that support HTTP endpoints. Whether you use Bubobot, Pingdom alternatives, or custom solutions, the approach remains consistent.
Scalability: As your infrastructure grows, adding new database monitoring simply requires deploying additional scripts and heartbeat endpoints. No licensing complications or agent management overhead.
Building Complete Monitoring Integration
The most effective approach combines traditional server uptime monitoring with heartbeat-based database monitoring to create comprehensive visibility without overwhelming complexity.
Integration Architecture:
- Infrastructure Layer: Traditional uptime monitoring for servers, networks, and basic service availability
- Application Layer: Heartbeat monitoring for database performance, custom business logic, and user experience metrics
- Alerting Layer: Unified notification system that correlates infrastructure and application health
Bubobot's Heartbeat Advantage: Platforms like Bubobot excel at this hybrid approach because they support both traditional monitoring methods and flexible heartbeat endpoints with advanced features like:
- 20-second monitoring intervals for rapid issue detection
- AI-powered anomaly detection that learns your performance patterns
- Smart notification silencing to reduce alert fatigue
- Integration with 20+ communication platforms for team coordination
This combination gives you enterprise-grade monitoring capabilities without enterprise-grade complexity or costs.
Key Takeaway: Heartbeat-based database monitoring provides the perfect middle ground between basic uptime checks and complex enterprise solutions—giving you actionable insights without overwhelming your team or budget.


