
Traditional monitoring tools stay silent because technically, your service is "up." Meanwhile, users get frustrated with slow page loads, and you're losing conversions without knowing it.
1. The Problem with Traditional Monitoring
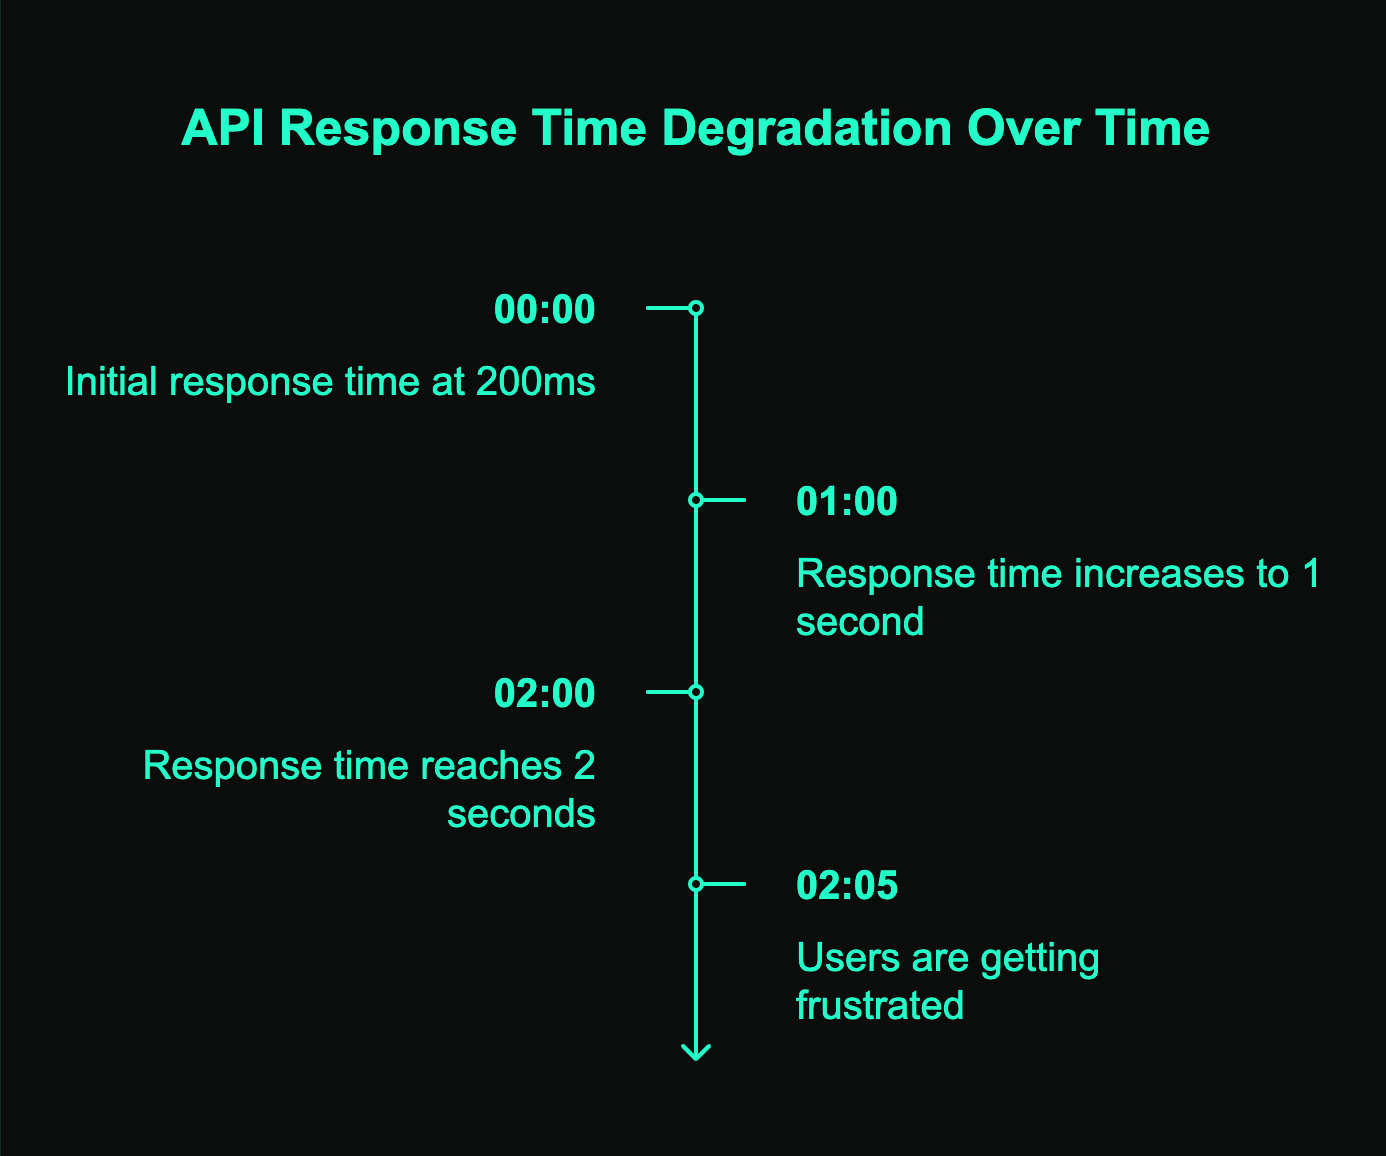
Imagine this: Your API response times slowly increase from 200ms to 2 seconds over several hours. Traditional monitoring uptime tools stay silent because technically, your service is "up." Meanwhile, users are getting frustrated with slow page loads, and you're losing conversions without even knowing it.
Most web uptime monitoring solutions work like smoke detectors – they only scream when the house is already on fire. Your team gets alerted after the damage is done, after users have bounced, after support tickets start flooding in. That's traditional monitoring in a nutshell, and honestly? It's not enough anymore.
Key takeaway: Waiting for complete outages means you're missing the early warning signs that could prevent bigger problems.
2. How Bubobot's Anomaly Detection Works
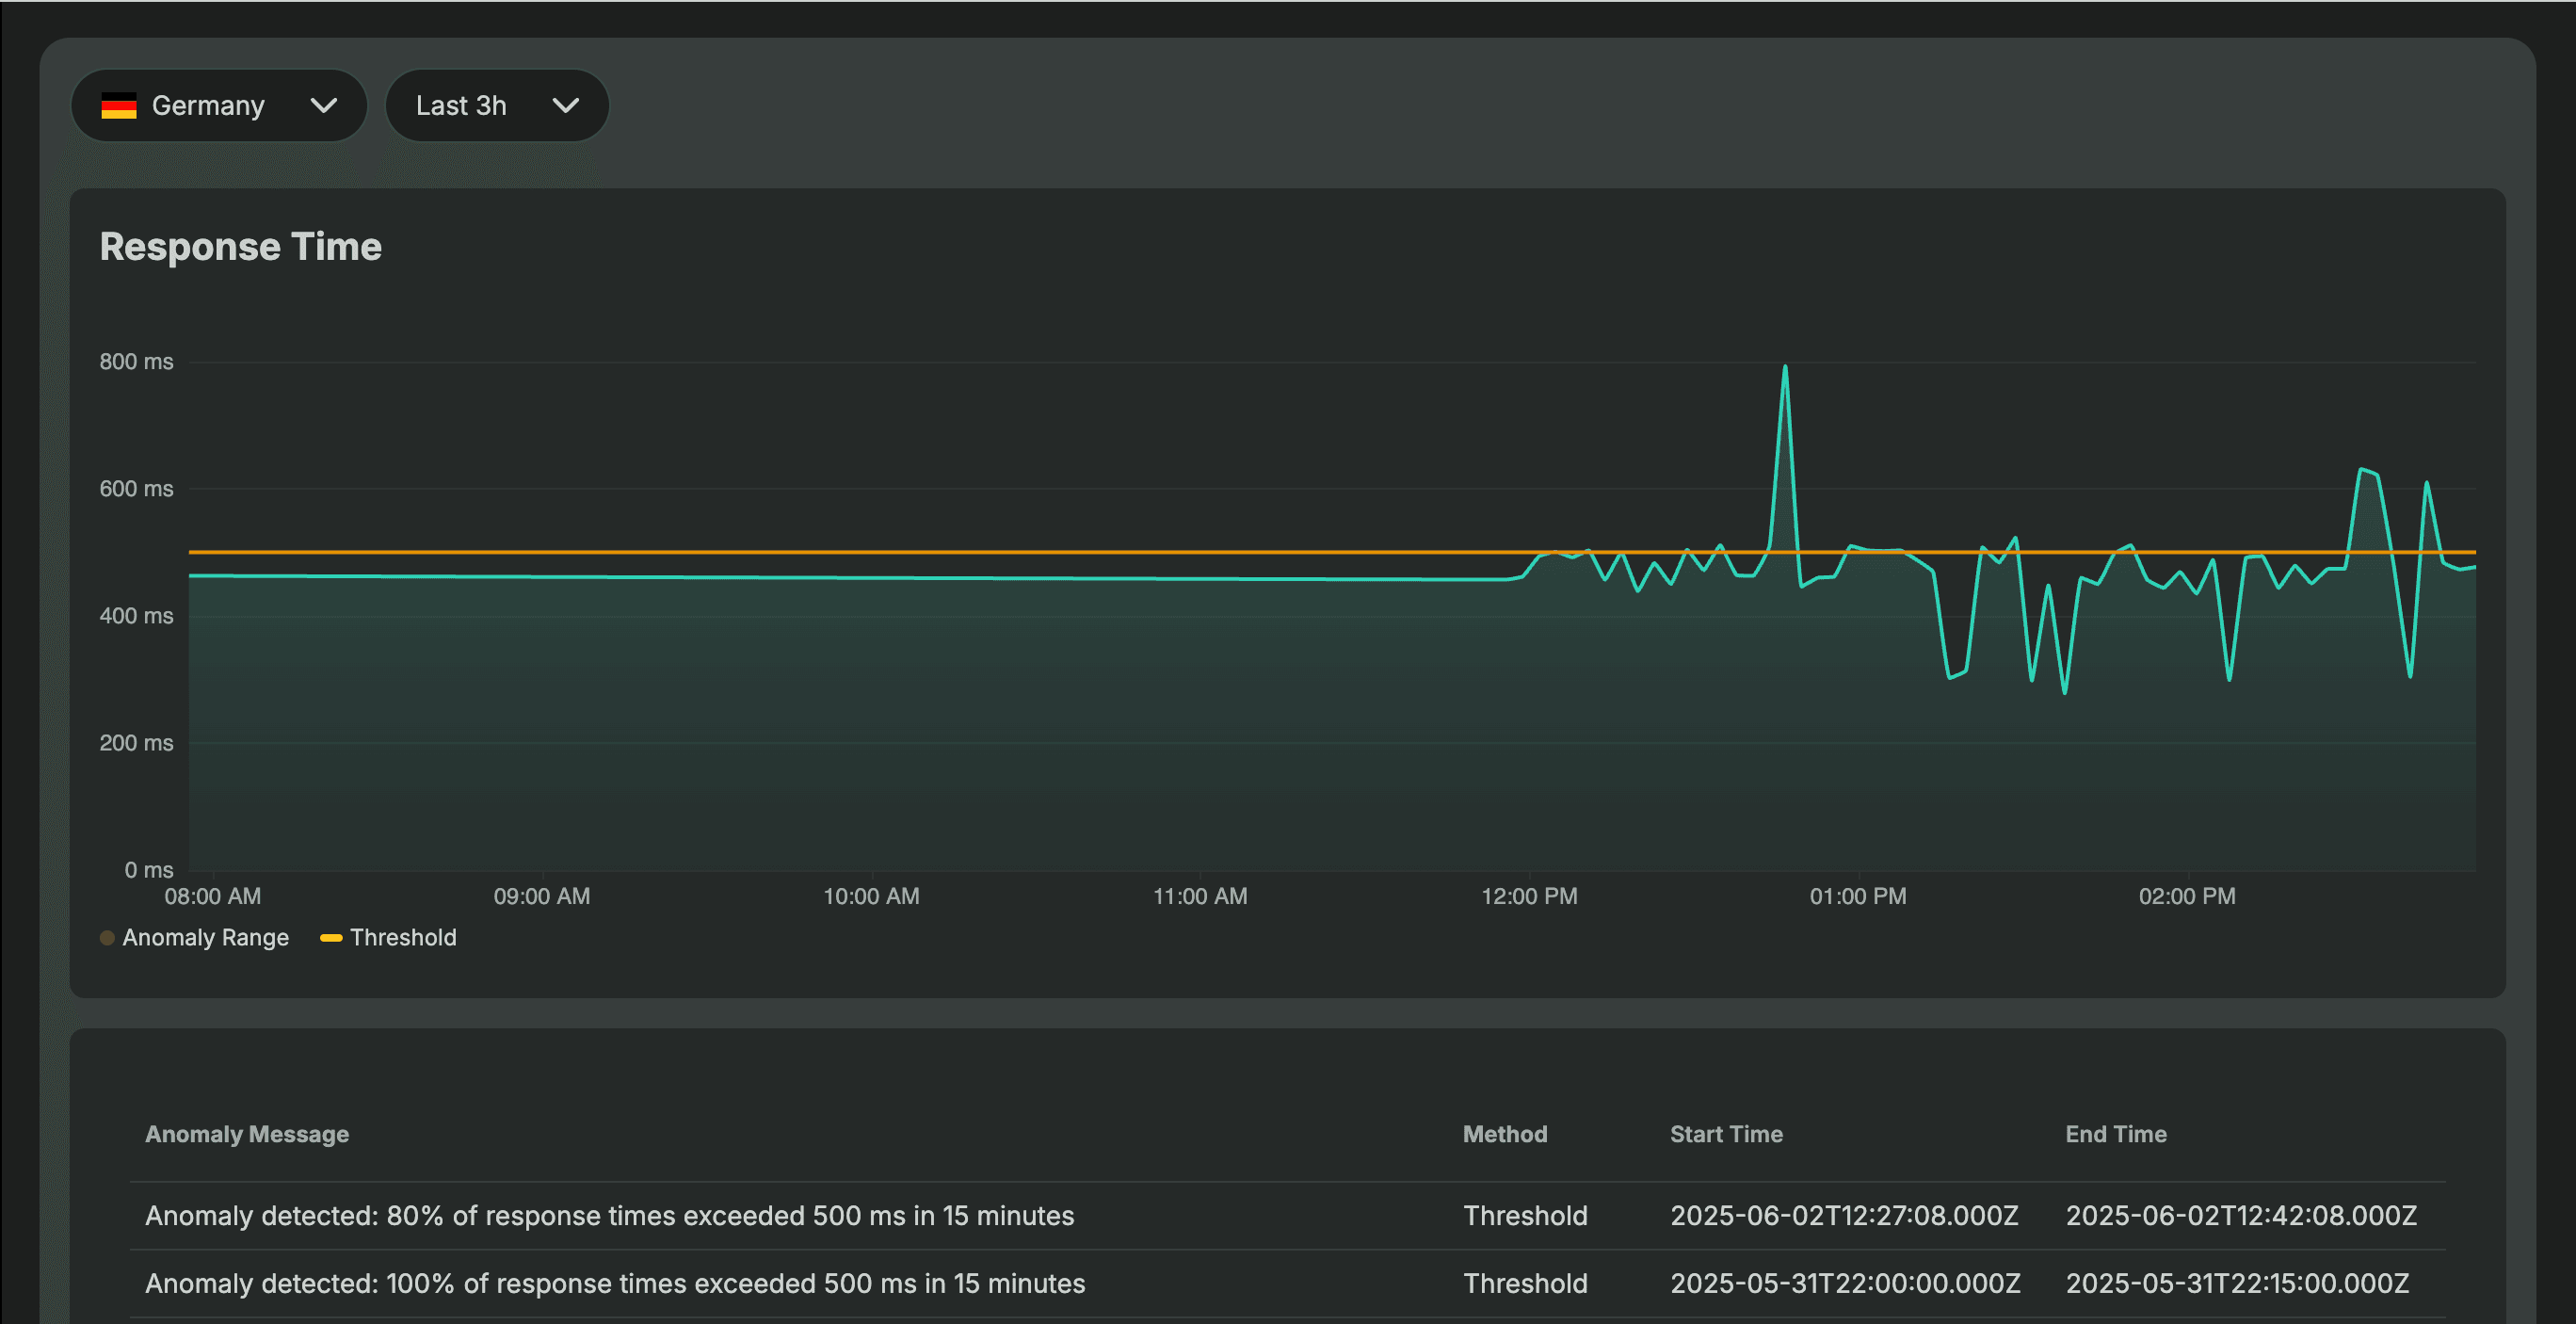
Bubobot's anomaly detection catches problems while they're still manageable. Instead of waiting for your systems to fail, our system analyzes response time data continuously and alerts you when performance starts degrading.
You get two detection methods to choose from, each designed for different monitoring needs and history requirements.
Threshold Method
The threshold method gives you precise control over alert triggers. You set a specific response time limit (like 5000ms) and define when to alert based on that threshold.
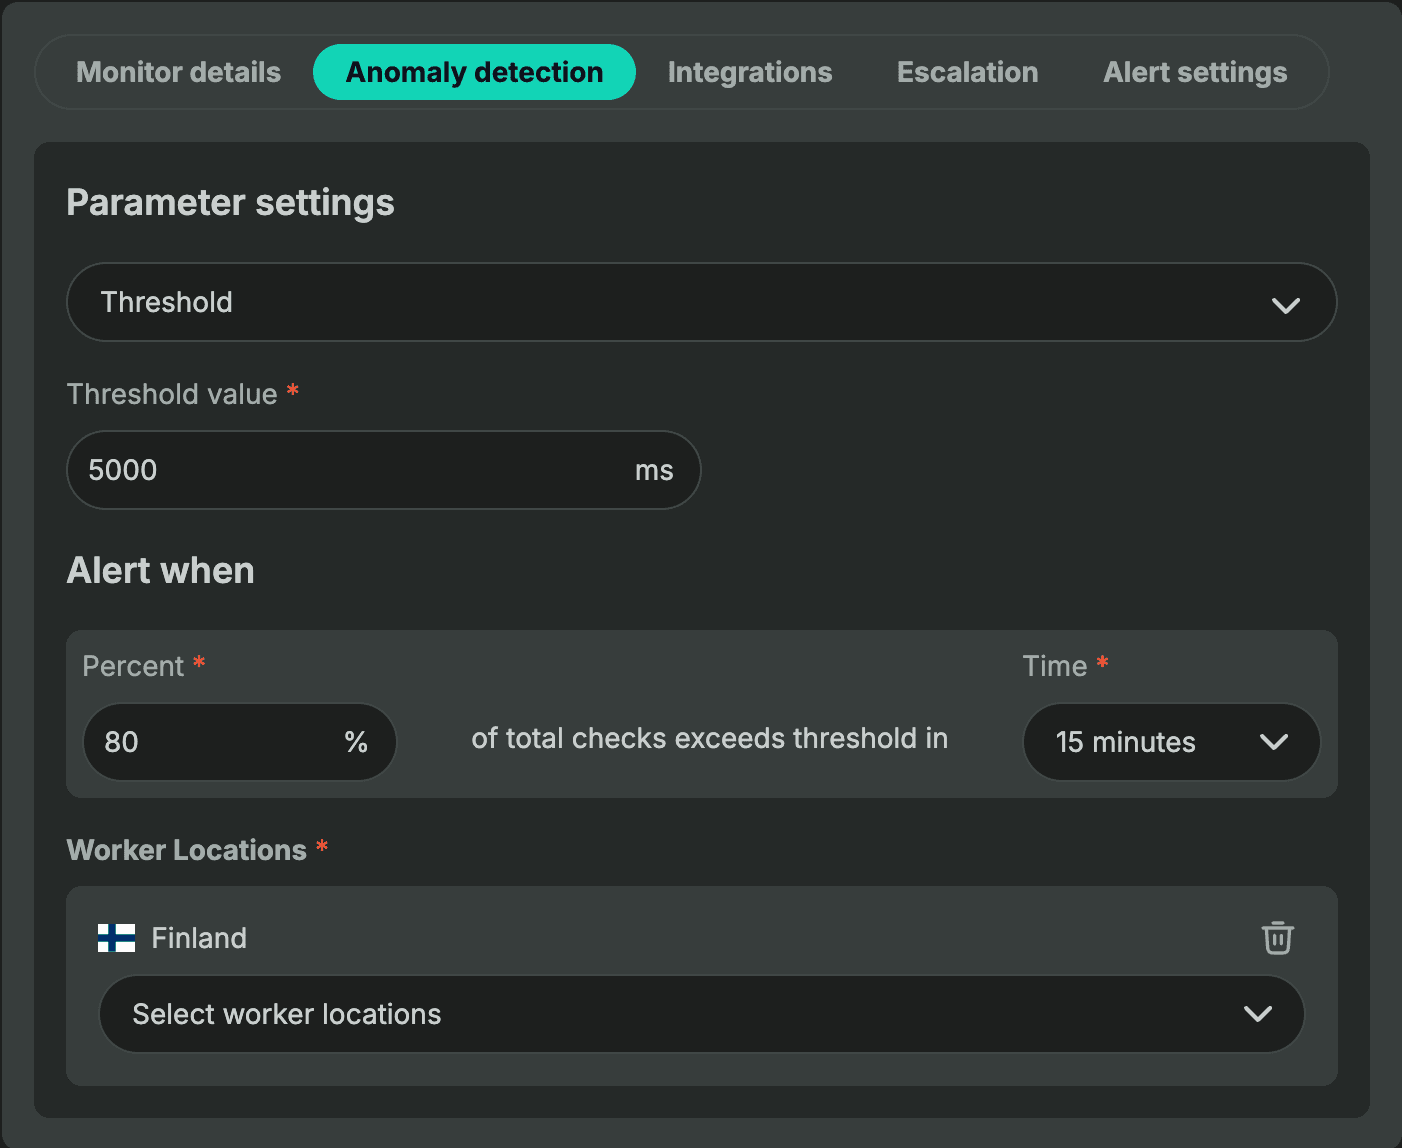
Example: Configure when 80% of total checks exceed your 5000ms threshold within 15 minutes, and Bubobot will trigger an alert.
This method works immediately after setup – no waiting period required. You define the rules, and Bubobot monitors against them from day one.
Bubobot AI Method
After 14 days of monitoring, our AI understands your baseline performance patterns – those response time changes that happen during peak hours or quiet periods.
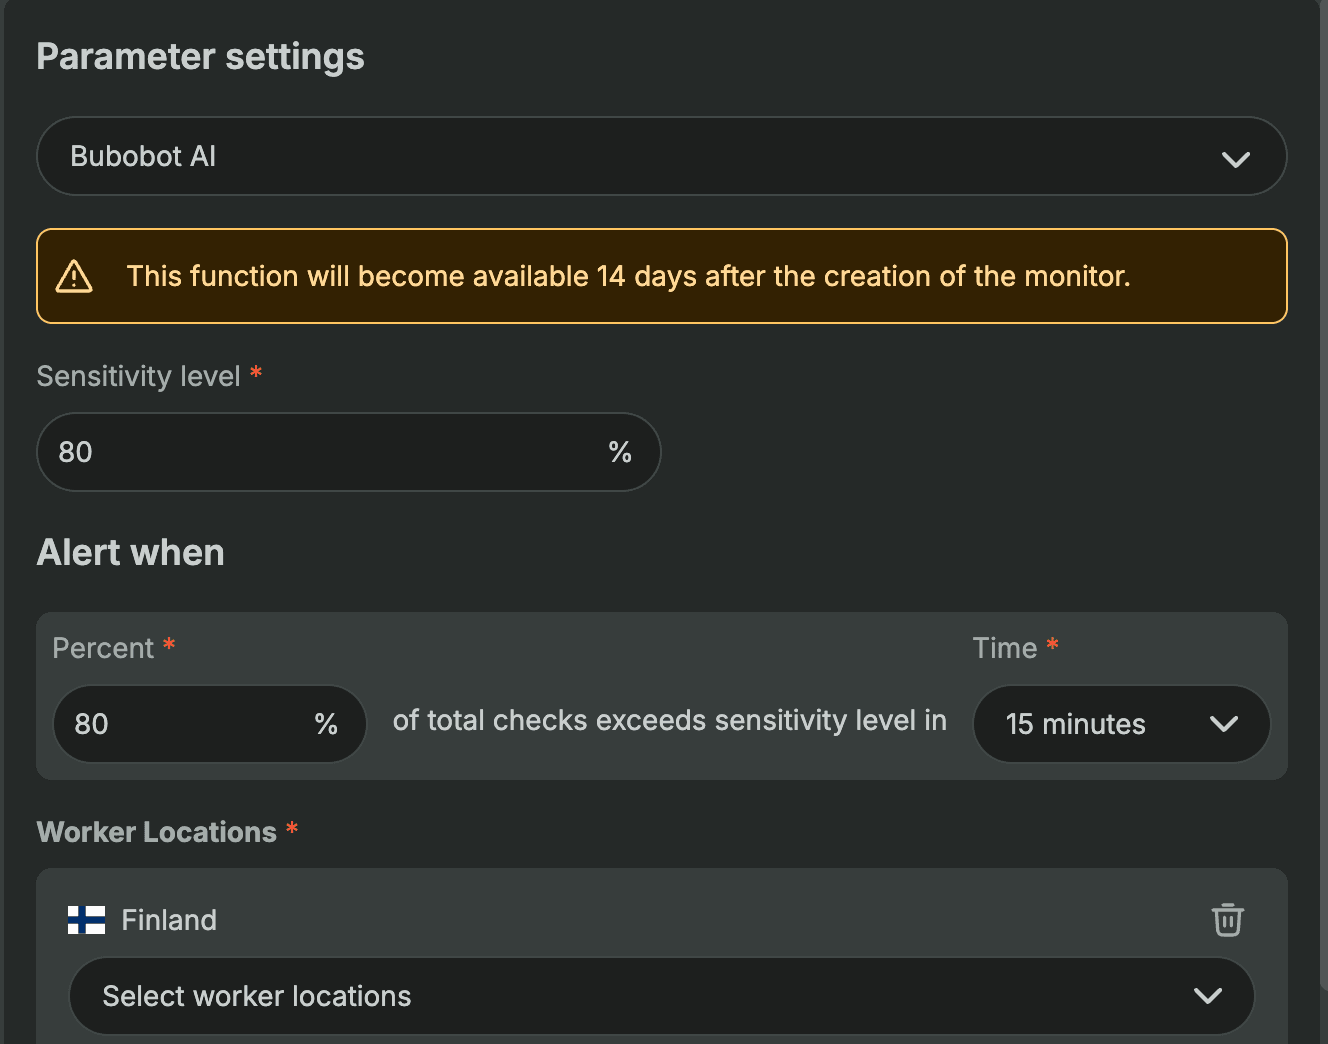
In this mode, you configure a sensitivity level (say 80%), and Bubobot's AI flags when 80% of your checks exceed what it considers normal based on your historical patterns. No more guessing at thresholds or constantly adjusting numbers as your traffic patterns change.
The AI adapts to your environment automatically. If your API typically runs slower during end-of-month processing, it learns this pattern and won't generate false alerts during those periods.
Pro tip: Start with the threshold method for immediate protection, then switch to AI detection once you have 14 days of data for smarter, context-aware monitoring (Bubobot will send you a suggestion email for that).
3. Understanding the 14-Day Learning Period
When you enable Bubobot's AI method, the system needs time to understand your unique performance patterns. During these first 14 days, Bubobot collects and analyzes your response time data to establish what "normal" looks like for your specific environment.
What happens during the learning phase:
- Bubobot tracks response times across different times of day, days of the week, and traffic patterns
- The AI identifies natural performance variations (like slower responses during peak hours or end-of-month processing)
- System learns your baseline performance and acceptable fluctuation ranges
- No AI-based alerts are triggered during this period (threshold method still works immediately)
Why 14 days matters: This timeframe captures at least two full weeks of traffic patterns, including weekday vs weekend variations, and accounts for most regular business cycles. Shorter periods might miss important patterns, while longer periods delay the benefits of intelligent monitoring.
4. Real-World Benefits and Use Cases
Anomaly detection transforms how you handle incidents from passive reactions to proactive prevention. Here's how different scenarios benefit from early detection:
- E-commerce websites during traffic spikes: Traditional uptime detector tools might miss gradual slowdowns as servers strain under increased load. Bubobot spots performance degradation early, giving you time to scale resources before customers abandon their carts during flash sales or peak shopping periods.
- API endpoint performance issues: When your APIs start responding slower than usual, it signals potential backend problems before they escalate. Website uptime monitoring with anomaly detection catches these early warning signs, letting DevOps teams investigate and fix issues before they impact user experience or trigger cascading failures across your application stack.
- DNS resolution problems: Performance degradation often precedes complete certificate or DNS failures. Server uptime monitoring with anomaly detection identifies these slowdowns early, giving teams time to renew certificates or fix DNS configurations before services become completely unreachable.
Key takeaway: Anomaly detection doesn't just catch problems faster – it prevents many incidents from becoming user-facing outages in the first place.
5. What's Next After Detection: DevOps Response Automation
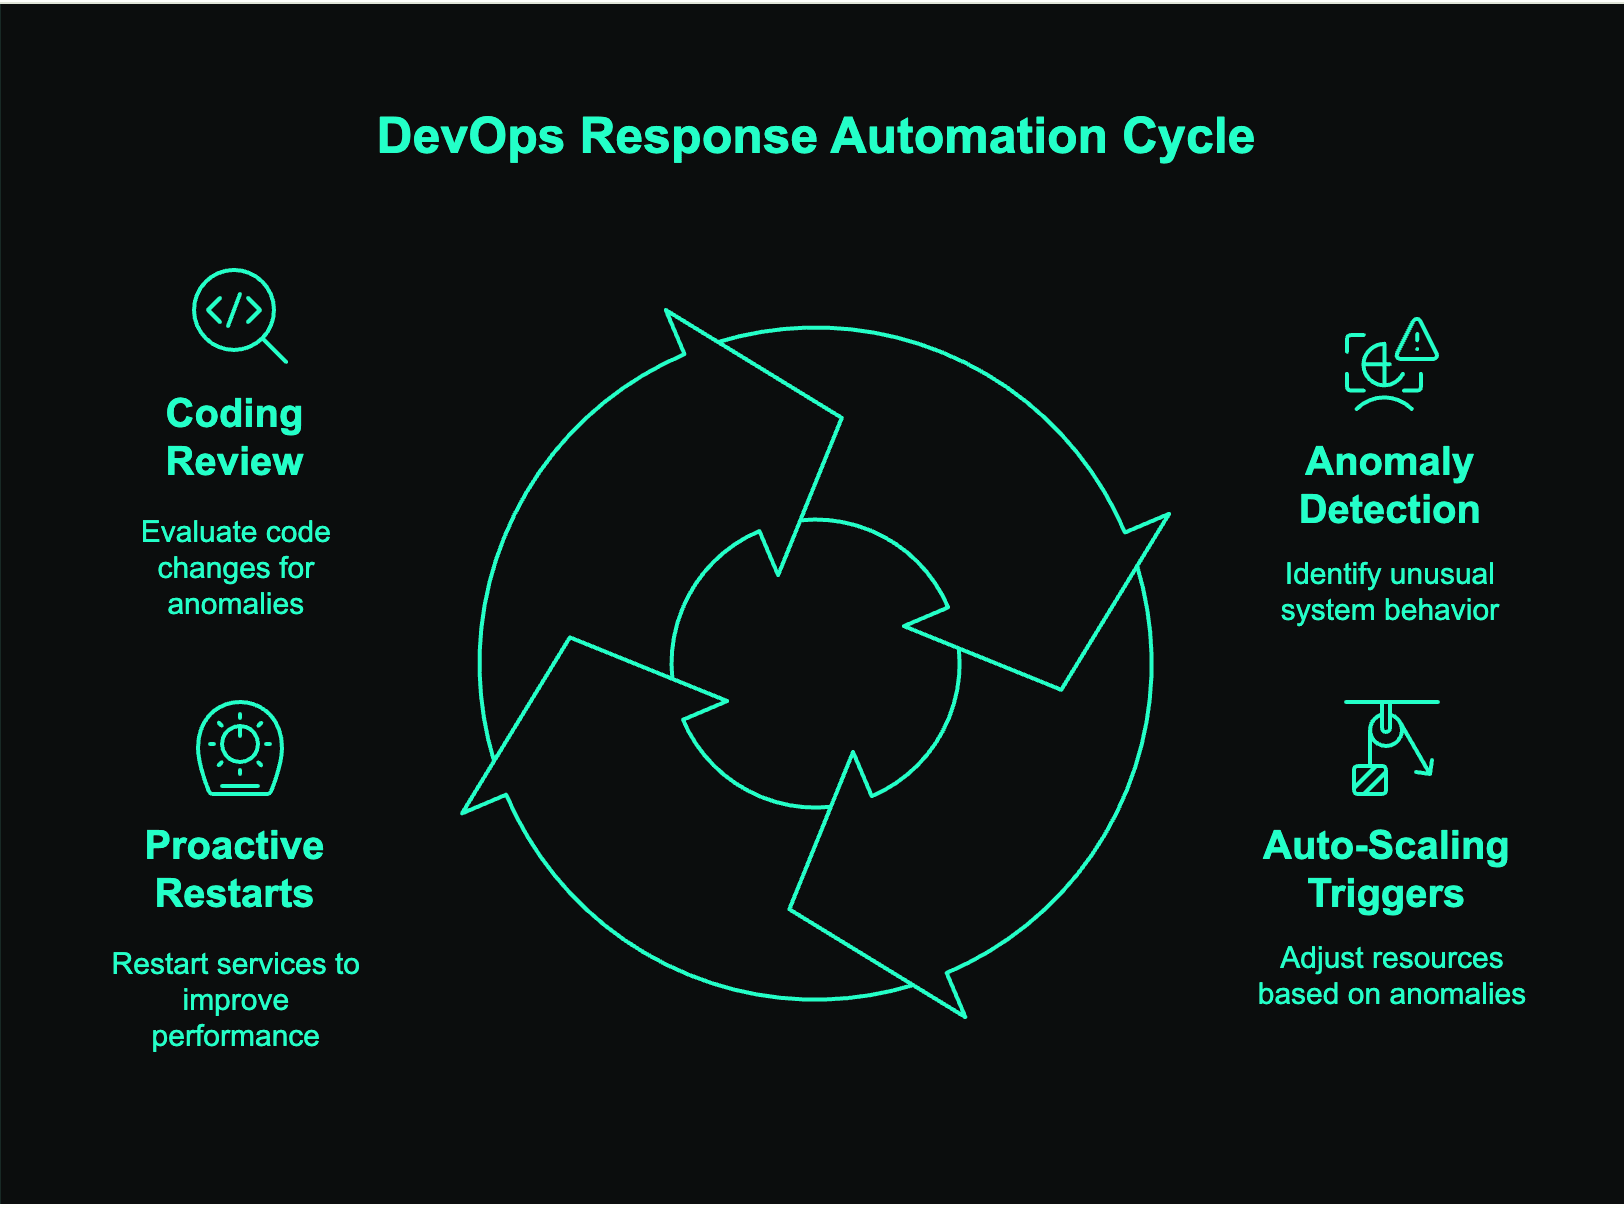
Anomaly detection is just the start – the real value comes from what you do with those early warnings. You can integrate seamlessly into your existing DevOps workflows and automation pipelines.
Response options:
- Auto-scaling triggers: Configure webhooks to automatically scale the system when anomalies are detected
- Proactive restarts: Automatically restart services/servers to serve users better.
- Coding review: You dev may need to review how the response time are changed unexpectedly.
Key takeaway: Anomaly detection transforms from reactive alerting to proactive automation, letting your systems self-heal before users notice any issues.


